
Baptiste Noel
Growth and co-founder of Metrikia
- Master en neurosciences et neuropsychologies cliniques
- Master en entraînement et optimisation de la performance
- Créateur SaaS et de contenu, 20 000+ abonnés LinkedIn
Co-founder of Metrikia, Baptiste is building a SaaS from scratch and shares the growth journey unfiltered. A former clinical-neuroscience researcher and physical-performance coach, he built then left a coaching business generating over 70,000 EUR per month before focusing on product. He writes about growth strategy, acquisition and scaling.
LinkedInWhy your reporting breaks before your campaigns when you scale
A reporting exists to decide, not to look busy. The four levels by cadence, why reporting breaks before campaigns, and the single source of truth.
On June 1, 2009, an Airbus flying from Rio to Paris went down in the Atlantic. Two hundred twenty-eight dead. The plane was intact, the engines were running. What gave out was three small iced-over airspeed sensors: for a few minutes, they fed the crew inconsistent speeds. Skilled pilots, at the controls of an aircraft flying perfectly, stalled and sank because their instruments were lying. In flight, a false instrument kills more surely than a dead engine.
Your ad reporting is that instrument panel. It is the instrument you decide with, to accelerate, cut, bank, and you only see reality through it. Yet most reporting lies exactly like iced sensors: it aggregates by hand data from different platforms, each with its own attribution, to display a crisp, false number. As long as you fly level, at stable budget, the gap stays small and you get away with it. The trouble comes when you push the throttle.
Because scaling is accelerating. The more budget you inject, the wider the gap between what the panel shows and what the bank collects, and you do not see it coming before the stall. It is not your campaigns that give out first when you scale, it is your ability to read what is happening. This article does not sell a tool. It sets the standard for a reporting that serves decisions, not busywork: structured by decision cadence, fed by a single source of truth, readable in seconds. Metrikia comes at the end, as what meets the grid.
What is a structured ad reporting?
A structured ad reporting is a reading system organized by decision cadence, not by data availability. Each level answers a precise question, at a precise rhythm, on a single source of truth: the CRM's actually-collected revenue crossed with spend, under one attribution method. It does not try to show everything, it tries to make you decide. Where a spreadsheet compiles incompatible data to produce a reassuring figure, structured reporting produces a decision: scale, cut, reallocate, wait.
It is the difference between a wall of gauges and a cockpit. The wall drowns you in data and leaves you deciding on gut. The cockpit shows you, at each moment, the one number you need for that moment's decision. A good reporting is not more complete, it is better ordered.
In this article, you will see:
- Why reporting is the real bottleneck of scaling, before creatives and audiences.
- The four-level framework, each with its cadence and its decision.
- Cohort analysis, the level almost no one holds and that decides your real profitability.
- The single condition without which the whole reporting lies: the source of truth.
Why reporting breaks before campaigns
When acquisition grows, we assume what will give out is the creatives fatiguing or the audiences saturating. In reality, what breaks first is the ability to read what is happening. And it breaks for two distinct reasons.
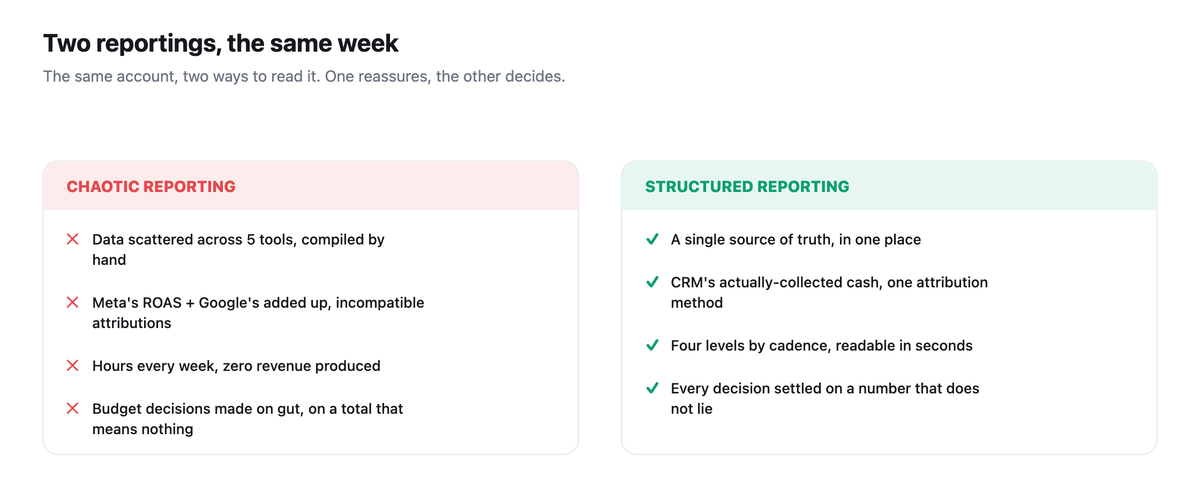
The first is the time cost. Compiling by hand a reporting that aggregates several ad accounts and CRM revenue takes hours every week, and those hours are exactly the ones that should go into optimization. The more channels and campaigns you add, the more the compilation swells, until reporting becomes a full-time job that produces no revenue.
The second is graver, because it is invisible. A patched-together reporting mixes sources that do not speak the same language: the ROAS Meta claims, the one Google claims, the conversions each platform declares with its own window. Adding these figures is stacking incompatible measurements to get a total that means nothing. You then decide on a false number, with the confidence a neat table gives. And when you scale, you do not correct the error, you multiply it by your budget. Reporting is not an account of what happened, it is the instrument you steer the next move with. A false instrument crashes the plane, whatever the pilot's talent.
The four-level framework, each at its cadence
A cockpit does not read all its instruments at the same frequency. Neither does a reporting. The principle is to separate levels by decision cadence, from the most frequent and fastest to the rarest and most strategic.
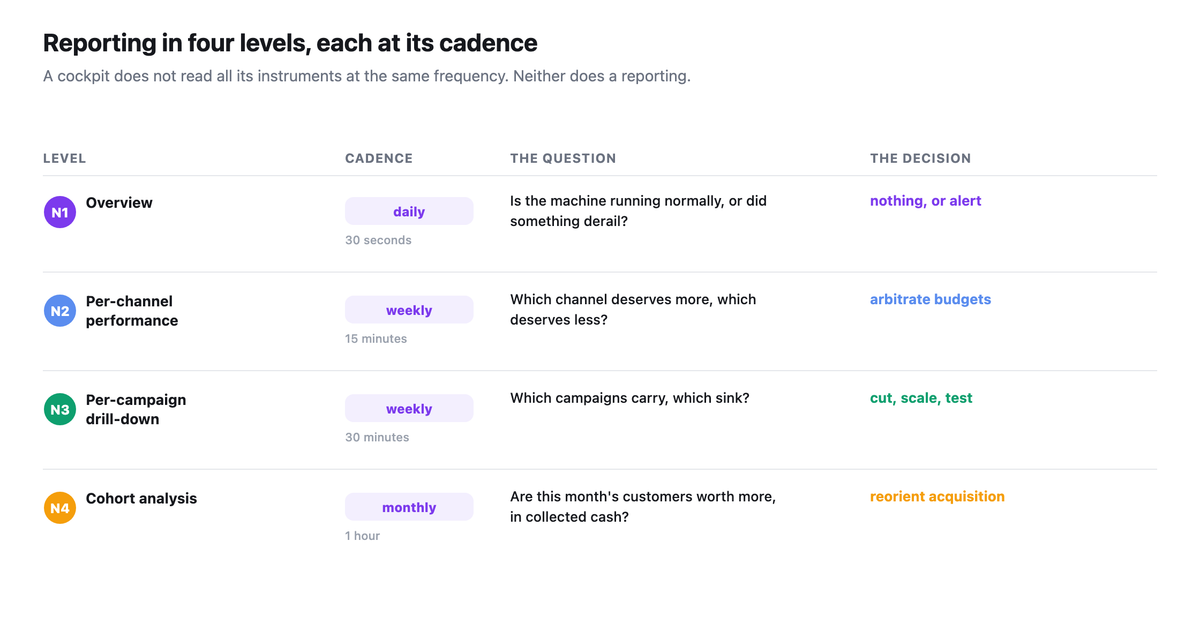
Level 1 is the overview, every day, in thirty seconds. A handful of numbers, no more: the day's spend, collected revenue, the global ratio, lead volume. The only question it asks is binary: is the machine running normally, or did something derail overnight? Level 2 is per-channel performance, every week, in a quarter of an hour. You compare Meta, Google, TikTok on real ROAS computed on collected cash, the lead-to-customer conversion rate, average basket by source, and each one's trend. The decision it triggers: which channel deserves more, which deserves less.
Level 3 is the per-campaign drill-down, every week, in half an hour. Inside each channel, you isolate the best campaigns, the worst to cut or rework, and the ones in test that do not yet have enough data to be judged. Level 4 is cohort analysis, every month, in an hour, and it is the most strategic because it is the only one that looks at time. Are the customers acquired this month worth more than last month's, once cash is actually collected? Is the conversion delay shortening? Which source brings the most loyal customers? Almost no one holds this level, and yet it is the one that says whether your acquisition is improving or degrading at depth.
The condition without which the whole reporting lies
You can have all four levels, the right cadences, a beautiful dashboard, and still be wrong down the line. Because the structure is only worth what the numbers it arranges are worth. The non-negotiable condition, the one that carries all the rest, is a single source of truth.
Concretely, that means three things. One attribution method, applied everywhere, so you never add incompatible measurements. The CRM's revenue, in actually-collected cash, as the truth reference, and not the conversions estimated by platforms that grade their own work. And one place where all this data meets, because if your numbers live in five tools, you will spend your time reconciling them instead of deciding. A structured reporting laid on scattered sources and incoherent attribution is a cockpit whose gauges are wired to different sensors: the crisper it is, the more confidently it deceives you.
Scaling reporting in 3 sentences - A reporting serves decisions, not busywork: it is organized by decision cadence, not by data availability. - What breaks when you scale is not first your campaigns, it is your ability to read correctly; a shaky reporting multiplies its errors by your budget. - Four levels (day, week by channel, week by campaign, month by cohort) laid on a single source of truth, in collected cash and one attribution.
Where Metrikia sits
A structured reporting is only worth something if it is fed by a single source of truth, and that is exactly the problem Metrikia solves before displaying anything. It aggregates the spend from all your connected ad accounts and crosses it with the CRM's actually-collected revenue, under one attribution method. The four levels then exist without a spreadsheet: a real-time overview, a per-channel and per-campaign reading with the filters you need, the pipeline tied to ad sources, and cohort analysis.
The gain is not cosmetic. It is the weekly compilation hours given back to optimization, and above all decisions made on a number that does not lie, because it comes from one source and one attribution. The goal was never to add one more dashboard to your collection, but to give you the cockpit that replaces the five spreadsheets, so scaling is an informed choice and not a headlong rush.
Frequently asked questions
How often should you look at your ad reporting? At several distinct cadences, one per decision level. A daily thirty-second overview to check nothing derailed, a weekly per-channel reading to arbitrate budgets, a weekly per-campaign drill-down, and a monthly cohort analysis. Looking at everything every day is as counterproductive as looking at nothing.
Why should you not compile your reporting in a spreadsheet? Because manual compilation costs hours every week and, above all, because it mixes incompatible sources: the ROAS Meta claims, Google's, conversions estimated with different windows. The resulting total means nothing, and you decide on it with the confidence of a neat table. The problem is not the spreadsheet, it is the absence of a single source of truth.
What is cohort analysis in ad reporting? It is the level that groups your customers by acquisition month and tracks their value over time, on actually-collected cash. It answers questions instant reporting cannot see: are this month's customers worth more than last month's, which source retains best, is the conversion delay shortening. It is the most strategic and most rarely held level.
Which metric should you watch first to scale? Real ROAS computed on collected cash, by channel, compared to your break-even, then the marginal return of the last euro to know which way to adjust a budget. A single metric watched alone, like a platform's ROAS, leads to wrong decisions; the coherence of the source matters as much as the metric.
References
BEA (Bureau d'Enquêtes et d'Analyses). (2012). Final report on the accident to Air France flight AF 447 Rio de Janeiro - Paris. https://bea.aero/en/investigation-reports/notified-events/detail/accident-on-1st-june-2009/
Meta. (n.d.). About return on ad spend (ROAS). Meta Business Help Center. https://www.facebook.com/business/help/375444268708687
Google. (n.d.). About attribution models. Google Ads Help. https://support.google.com/google-ads/answer/6259715
Baptiste Noel, co-founder of Metrikia. MSc in Clinical Neuroscience and MSc in High Performance.