
Baptiste Noel
Growth and co-founder of Metrikia
- Master en neurosciences et neuropsychologies cliniques
- Master en entraînement et optimisation de la performance
- Créateur SaaS et de contenu, 20 000+ abonnés LinkedIn
Co-founder of Metrikia, Baptiste is building a SaaS from scratch and shares the growth journey unfiltered. A former clinical-neuroscience researcher and physical-performance coach, he built then left a coaching business generating over 70,000 EUR per month before focusing on product. He writes about growth strategy, acquisition and scaling.
LinkedInThe Seven-Figure Machine: The Complete System to Scale an Ecommerce Store
The complete guide to scale an ecommerce store to seven figures: five systems, offer to retention, with the concrete thresholds and cadences.
In January 2020, Casper filed to go public, and the numbers told two opposite stories on the same page. The first was a triumph: revenue had grown from 251 million dollars in 2017 to 439 million in 2019. The second, a few lines down, was a disaster: over the first nine months of 2019, marketing and sales had absorbed more than 73 percent of gross profit, and the company was losing tens of millions a year (Casper Sleep Inc., 2020). Listed at 12 dollars, the stock was ultimately taken private in 2022 at 6.90 dollars. The brand had never sold more, and had never been closer to dying.
Casper had the budget, the awareness, and slick creative. What it lacked was none of those levers in isolation, but the system that connects them. Because scaling an ecommerce store is not a question of spending more. Advertising is a multiplier, not a repairer: it amplifies the economics that already exist underneath. Pour budget onto a low-margin offer, creative that doesn't convert, or blind measurement, and you simply accelerate your path to the wall. Pour it onto a well-tuned machine, and every euro works for you.
If you run a store and you're in the fog with your numbers, this guide is for you. It describes the complete machine that brands crossing the million follow, in the exact order its parts fit together, with the thresholds, cadences, and concrete methods of each stage. Not a financial theory, an operating system.
On the menu:
- Why paid is a multiplier, and the order of causality 90 percent of brands invert.
- The offer: the upstream constraint that decides whether you're allowed to scale.
- Creative: the real growth lever in 2026, and at what cadence seven-figure brands produce it.
- The modern acquisition structure: feeding the algorithm instead of micromanaging audiences.
- Measurement: the foundation that clears the fog and fuels the algorithm, not just reporting.
- Retention and the complete sequence, tier by tier, up to the million.
The mental model: five systems, in a non-negotiable order
Most brands treat scaling as a single move, raising the budget, then watch ROAS drop without understanding. The truth is that scaling is a chain of five systems, and the order matters as much as the parts.
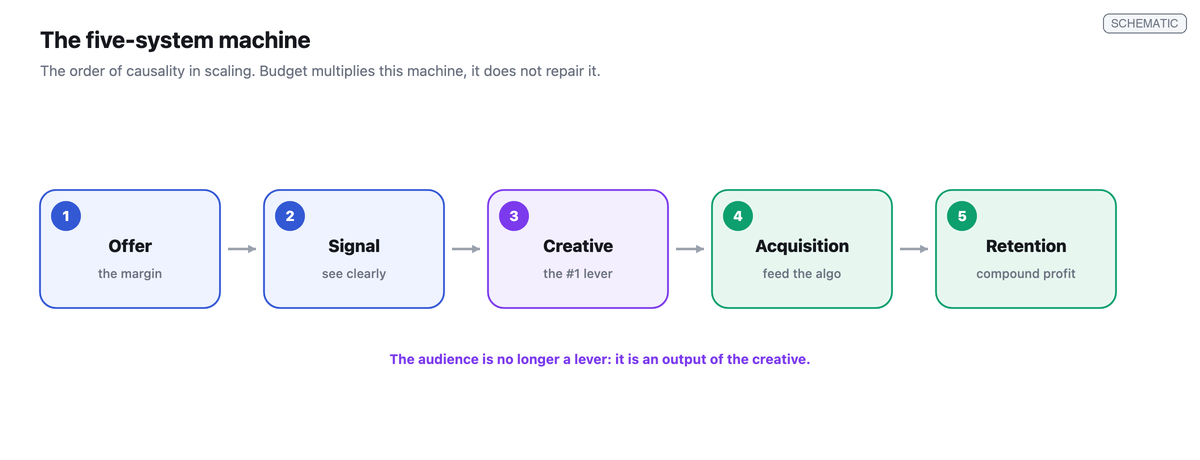
The order of causality is as follows. First the offer, because it sets the margin, and margin decides how much you can pay for a customer. Then the signal, that is, measurement and tracking, because a blind algorithm and a blind operator make random decisions. Then the creative, now the first lever you still control once targeting is automated. Then the acquisition structure, whose role is no longer to choose audiences but to feed the machine. And finally retention, which turns fragile unit economics into compounded profit. The audience is no longer a lever: it has become an output of the creative. Those who invert this order, pushing the budget before fixing the offer and the signal, are exactly the ones who scale into bankruptcy.
System 1, the offer: you don't scale a product, you scale a margin
It all starts with a brutal question: does your offer leave enough margin to buy customers profitably. If the answer is no, none of the following systems will save you, they will accelerate the loss.
The mechanism is arithmetic. Take an acquisition cost of 60 dollars, a basket of 75, and a real gross margin of 22 dollars once cost of goods and logistics are deducted: every order digs a 38-dollar hole, and scaling only multiplies that hole (Glickman, n.d.). That's why there is a threshold before which scaling is forbidden. Aim for a post-advertising contribution margin of at least 35 percent to have room to maneuver; below 25, margins compress faster than the top line grows; under 15, you're buying your customers at a loss (Saras Analytics, n.d.).
The good news is that the offer is a lever, not a fate. Alex Hormozi formalizes it with his value equation: perceived value is the product of the dream outcome and the perceived likelihood of achieving it, divided by the time delay and the effort asked of the customer (Hormozi, 2021). A commodity offer competes on price and destroys margin; an offer built to maximize the top of the equation and crush the bottom escapes the comparison and finances its own acquisition. Concretely, before touching the ad budget, work three margin levers at near-zero acquisition cost. The post-purchase upsell, triggered after payment and therefore risk-free on conversion, raises the average order value by 10 to 20 percent (Finaloop, n.d.). Bundles add 15 to 25 percent of average order value (EcomHint, n.d.). And a free-shipping threshold set about 30 percent above your average order value mechanically pulls the value of each order up (Shopify, n.d.). Every point of margin gained here is a point you'll be able to reinvest in acquisition.
System 2, the signal: clear the fog before you accelerate
Here is the piece the pain of a store lost in its numbers points to directly. Before scaling, you have to see clearly, and seeing clearly has stopped being automatic. Apple's App Tracking Transparency erased the advertising identifier for about three quarters of iOS users, and the browser pixel now loses signal on four sides at once, ATT, Safari's protections, ad blockers, and Chrome's evolution. Meta put the impact of that shift at about ten billion dollars in 2022 alone (Meta, 2022).
The crucial point, the one most brands miss, is that the signal is not just a reporting matter. It's a performance fuel. The bidding algorithm optimizes against the conversions you report to it; if that signal is patchy, it bids against a distorted subsample and wastes your budget. That's why the pixel and the Conversions API must run in parallel, deduplicated by a shared event identifier, to give the machine a complete picture of your real sales. The quality of that matching is measured, at Meta, by Event Match Quality, a score from zero to ten: above about 7.5 on purchases, the algorithm exits its learning phase faster and targets better (Meta for Developers, n.d.). We detail this plumbing in our guide to building a complete tracking system.
But capturing the signal isn't enough, you have to judge it. And this is where the layer of truth above the ad dashboards comes in, because the ROAS the platform displays is both inflated and average. Inflated because each platform claims the same sales, a mechanism we take apart in our article on the ROAS Meta shows you that is wrong. Average because it hides the cost of the next customer behind the cost of the average customer. These two blind spots are precisely what makes brands scale blind, and they deserve a pause, because they decide everything else.
The measurement that allows or forbids you to accelerate
The strategic compass of scaling is not ROAS but MER, the Marketing Efficiency Ratio, which relates all real revenue to all marketing spend.
` MER = Total revenue / Total marketing spend `
Because it never asks which channel made the sale, MER cannot double-count, unlike the sum of platform ROAS. It becomes the reference number the moment you spend seriously across several channels, and Common Thread Collective puts a healthy MER above 4 (Common Thread Collective, n.d.). We develop this shift in our MER guide.
Under MER, you have to read contribution margin in three tiers. CM1 is revenue minus landed cost of goods. CM2 removes the order's variable costs, logistics, shipping, payment fees. CM3 finally removes marketing spend, and it's the only number you should scale, because revenue can rise while CM3 turns negative, which is exactly Casper's mechanism.
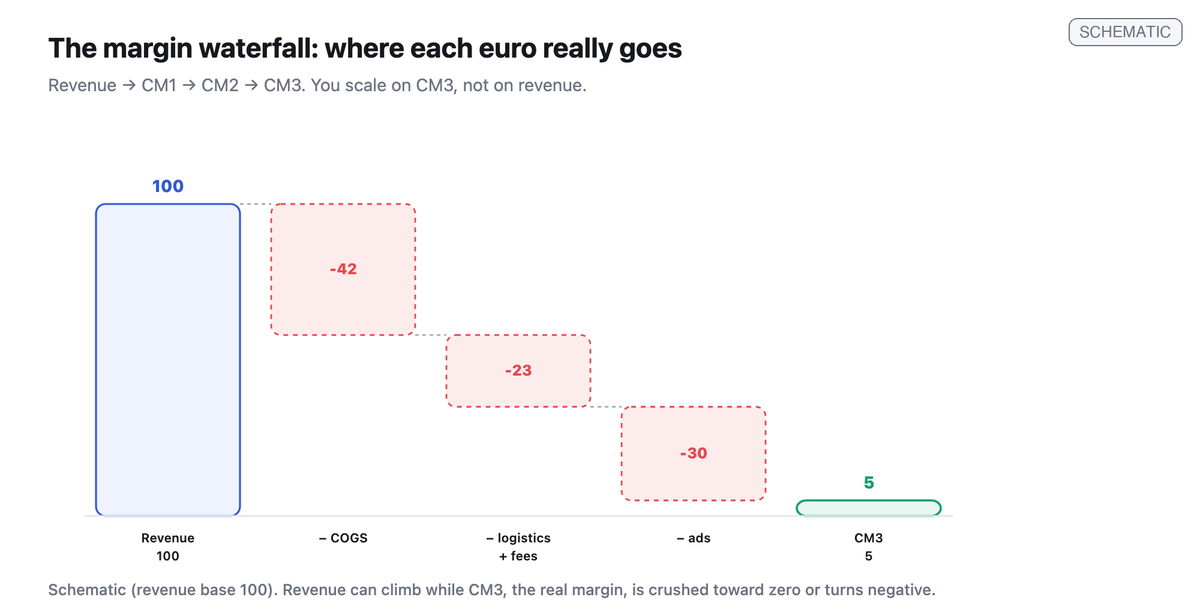
That leaves the most expensive trap, average cost versus marginal cost. When you compute your acquisition cost on all your spend divided by all your customers, you get a flattering blended CAC, inflated by the organic customers you didn't pay for, which predicts nothing about what happens when you push the budget. The number that decides scaling is marginal CAC, the cost of the next customer, measured on the change in spend.
` Marginal CAC = Δ spend / Δ new customers `
It matters because the next euro always costs more than the average euro: as you push, you exhaust the receptive audiences and reach more expensive pockets. Common Thread Collective sums up this mechanism with a sentence to remember, blended will always trail marginal (Common Thread Collective, n.d.). In plain terms, the marginal dollar turns unprofitable weeks before your average flinches.
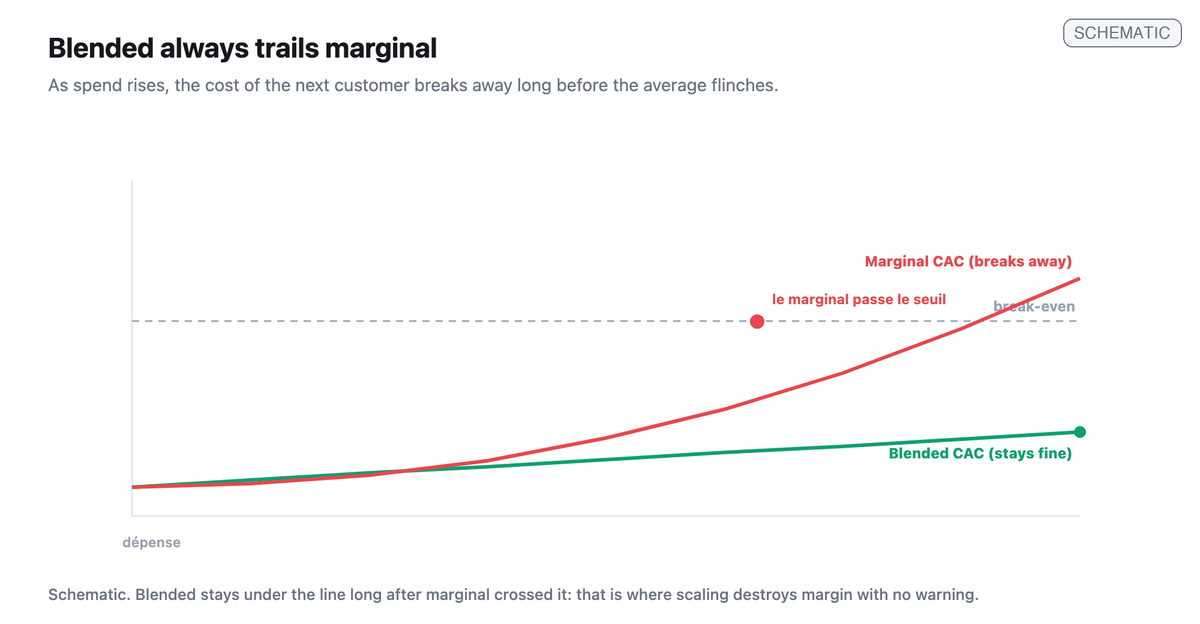
The practical rule follows: you push spend to the point where marginal CM3 hits break-even, which equals one divided by your margin, not to the point where the blended looks fine. And to know what advertising actually caused on that last euro, only a holdout answers, provided by an incrementality test.
System 3, creative: the only lever you have left
Here is the most important reversal of the past decade, and the one most guides still ignore. You no longer scale spend, you scale creative. Since algorithms automate targeting, bidding, and placements, creative has become the primary signal the machine uses to decide whom to show your ad to. As Triple Whale sums it up, creative is now the targeting: your ad is the input the platform reads to find the audience (Triple Whale, n.d.). Meta's retrieval engine, generalized in early 2026, made this shift structural. The audience is no longer something you choose, it's something your creative produces.
The operational consequence is a change of scale. Most brands run three to five active creatives; those that scale run dozens, and produce them at an industrial cadence. Taylor Holiday, of Common Thread Collective, puts it bluntly: most of your creatives won't work, so you have to make far more than you think you need (Common Thread Collective, n.d.). Here are the orders of magnitude brands follow by spend level.
| Spend tier | New creatives per month | Active creatives at once |
|---|---|---|
| 0 to 10k$/mo | 5 to 10 | 3 to 8 |
| 10 to 50k$/mo | 20 to 40 | 15 to 30 |
| 50 to 250k$/mo | ~50 per week | 80 to 150 |
| 250k$ to 1M/mo | 100+ per week | 150 to 300 |
This cadence is not a whim, it follows from the win rate. On a dataset of more than 550,000 ads analyzed by Motion in 2026, only 4 to 8 percent of creatives become winners, and about 5 to 6 percent of them carry the majority of the spend (Motion, 2026). Operator consensus converges on roughly one winner in ten. The consequence is mathematical: to find ten winners at a 15 percent rate, you have to test nearly seventy. Nick Shackelford, who has managed more than 200 million dollars of spend, launches twenty ads every Monday, fifteen iterations of winners and five fresh concepts, and reminds us that it takes ten to twenty ads to distinguish a real winner from mere statistical noise (Shackelford, n.d.).
Concretely, here is how to produce and test. Distinguish the concept, a fresh creative direction, from the iteration, a variation of an already-proven asset. Test the hooks first, the first three seconds, then iterate the winners. Devote 20 to 40 percent of the budget to testing, and consider a creative to have won when it reaches twenty to thirty conversions at the target cost. Then split the budget by the 70/20/10 rule: 70 percent to proven winners, 20 to iterations, 10 to the experimental. Watch the hook rate, the share of three-second views, which should exceed 30 percent, and the hold rate, above 25 percent for a strong creative (Motion, 2026). One guardrail, though: a high hook rate does not guarantee performance, always optimize the final result and not the mere thumb-stop.
The textbook case is The Ridge. The brand launched more than five hundred ads in about ten days, kept seventy-eight active, an elimination rate of 84 percent, and built on that throughput a machine of more than 200 million dollars in sales (Foreplay, n.d.). The edge is not the genius of one ad, it's the throughput and the speed of elimination. Creative is treated as a portfolio of disposable bets, not as a work of art.
System 4, acquisition: feed the machine, don't micromanage it
Once the offer, the signal, and the creative are in place, the acquisition structure becomes simple, almost counterintuitive. Meta's automated campaigns, Advantage+ Shopping, take charge of targeting, placements, creative selection, and budget allocation. The old reflex of creating ten ad sets to read each one separately is exactly the mistake: it fragments the budget and prevents the algorithm from reaching the threshold it needs.
That threshold is the one canonical Meta number to know: an ad set needs about fifty conversions per week to exit its learning phase (Meta, n.d.). Below that, it stays stuck in limited learning, and its performance is erratic. All the modern structure logic, campaign consolidation, budget floors of at least fifty dollars per day per ad set, follows from this: concentrate conversions above that threshold to give the machine a clean signal. And since the algorithm reads the creative to find buyers, the golden rule becomes: test the creative, not the audiences. Interest targeting usually adds only noise the model would resolve better on its own, provided you give it five to ten distinct concepts to explore.
System 5, retention: the multiplier acquisition never replaces
Acquisition fills the bucket, retention makes it profitable. Drew Sanocki sums up ecommerce growth with three multipliers, the number of customers, the average order value, and the purchase frequency, and the key point is that they multiply: raising each by 30 percent doesn't make plus 90 percent but plus 220 (Sanocki, n.d.). Yet brands that scale badly push only the first, the most expensive one, leaving the other two asleep.
Retention is not loyalty, it's economic survival. Per the work relayed by Harvard Business Review, raising retention by five percent increases profit by 25 to 95 percent, and acquiring a customer costs five to twenty-five times more than retaining one (Gallo, 2014). The first order is almost always unprofitable once acquisition is deducted; profit is earned on the following orders, recovered cheaply through the channels you own, email and SMS first, which should eventually represent a major share of your revenue.
This imposes a way of reading lifetime value, and it's a statistical trap many ignore. LTV is never read as a global average, because of Simpson's paradox: the average can look stable while each cohort degrades, simply because the mix's composition changes, pulled up by the old loyal customers while recent cohorts decline in silence. LTV is read by cohort, tracking each group along its retention curve. It's the only way to see whether your economics deteriorate as you scale.
It's also the double signature of the brands that truly succeed. True Classic went from three thousand to three hundred million dollars in five years by pulling both levers at once: hundreds of creative variations a month, each concept tested across up to six different hooks, and in parallel a tiered offer scale plus a one-dollar-a-month subscription gathering more than a hundred thousand members (Mayple, n.d.). Creative volume lowers acquisition cost, the offer scale raises the basket, the subscription turns the one-time purchase into recurring revenue. It's the whole machine running, not an isolated lever.
The complete sequence, tier by tier
Each growth tier has its own bottleneck, and clearing it means knowing which one will break first.
| Tier | What breaks first | What to focus on |
|---|---|---|
| 0 to 10k$/mo | The offer and the hook: no brand yet | Prove demand, a hook that converts, a healthy-margin offer |
| 10 to 100k$/mo | Operations and margin discipline | Hold CM3 above 30 to 40 percent, move to 3PL around 500 orders a month |
| 100 to 500k$/mo | Creative volume, then media buying | Industrialize creative production, steer on the marginal |
| 500k to 1M/mo | Cash to finance inventory | Finance a cash cycle of about 90 days, activate retention |
The killer of the million is almost never a lack of sales, it's cash. To sell three times more, you have to finance three times more inventory, advertising, and logistics weeks before the cash arrives, and a brand profitable on paper can find itself dry at the peak of its growth (Ask-Luca, n.d.). The cash conversion cycle, the days your money is locked in inventory and awaiting payment minus the supplier terms, is the real governor of the speed at which you can press the accelerator.
The dashboard that governs everything
Let's bring it together. An ecommerce store is not scaled on revenue or platform ROAS, but on a machine whose every part has its dial. Does the offer carry a sufficient contribution margin. Is the signal complete enough for the algorithm and you to see clearly. Does the creative produce enough winners to feed the spend. Does marginal CAC still clear break-even on the next euro. And does cash return fast enough to finance the pace. As long as these dials are green, you can push. The moment one turns red, growth becomes disguised debt, however bright the top line.
That is exactly the foundation a measurement layer like Metrikia operationalizes: reconciling ad spend to the revenue actually collected, by channel and by campaign, so that the number you scale on is the money actually banked and not a platform's estimate. Metrikia replaces neither your creative, nor your offer, nor your accountant; it anchors daily measurement to real cash, the condition for all the other dials to tell the truth, and for finally clearing the fog.
Casper sold half a billion and lost money; Jones Road sold a fifth of that and made its own, steering on margin and not on revenue (Modern Retail, 2023). The difference was neither budget nor talent, but the system. Scaling a store is not a burst of acceleration, it's a machine, and a machine is steered on the right dials.
Frequently asked questions
How do you scale an ecommerce store to a million? By treating scaling as a five-system machine, in order: an offer with sufficient margin, a complete measurement signal, industrial creative production, an acquisition structure that feeds the algorithm, and retention that compounds profit. Budget comes last, because it multiplies this machine; pushed too early, it mostly multiplies losses.
What is the real scaling lever in 2026? Creative. Since platforms automate targeting and bidding, the ad is the input the algorithm reads to find the audience. Brands that scale produce dozens of creatives a week because only about one in ten becomes a winner, and they test hooks before iterating the winners.
Why not target precise audiences on Meta? Because the modern algorithm finds buyers better on its own, from creative and conversion signals, if you give it a clean signal and five to ten concepts to explore. An ad set needs about fifty conversions a week to exit learning; fragmenting the budget into multiple audiences prevents it. The rule is to test the creative, not the audiences.
What margin do you need to be able to scale? Aim for a post-advertising contribution margin of at least 35 percent to have room to maneuver. Below 25 percent, margins compress faster than the top line grows; under 15, you buy your customers at a loss. Before pushing the budget, raise the margin through the offer, bundles, and post-purchase upsells.
Why is my store growing without me making money? Because you're probably steering on revenue and platform ROAS, the two most visible and most misleading numbers. Revenue ignores margin, platform ROAS is inflated and average. Steer on CM3 contribution margin and the cost of the next customer, and check that your cash keeps pace.
What breaks a brand at the moment of crossing the million? Most often cash, not sales. Financing three times more inventory and advertising before collecting drains an otherwise profitable brand. The cash conversion cycle governs the self-fundable growth rate, and it's what to watch when you accelerate.
References
Ask-Luca. (n.d.). Ecommerce KPIs: contribution margin, payback and the cash conversion cycle. https://ask-luca.com/blogs/ecommerce-kpis
Casper Sleep Inc. (2020). Form S-1 registration statement. U.S. Securities and Exchange Commission. https://www.sec.gov/Archives/edgar/data/0001598674/000104746920000166/a2240404zs-1.htm
Common Thread Collective. (n.d.). Scale creative ideation, and marketing efficiency ratio. https://commonthreadco.com/blogs/ecommerce-playbook/scale-creative-ideation
EcomHint. (n.d.). Ecommerce cross-selling, upselling and bundling. https://ecomhint.com/blog/ecommerce-cross-selling-upselling-bundling
Finaloop. (n.d.). The science of upselling: how top Shopify brands boost AOV. https://www.finaloop.com/blog/the-science-of-upselling-how-top-shopify-brands-boost-aov-by-10-20-post-purchase
Foreplay. (n.d.). The Ridge ad auction analysis. https://www.foreplay.co/post/the-ridges-ad-auction-analysis
Gallo, A. (2014). The value of keeping the right customers. Harvard Business Review. https://hbr.org/2014/10/the-value-of-keeping-the-right-customers
Glickman, J. (n.d.). Ecommerce scaling is a margin problem, not a paid-media problem. https://www.jordanglickman.com/writing/ecommerce-scaling-vs-margin-problem-paid-media
Hormozi, A. (2021). 100M Offers. Acquisition.com.
Meta. (2022). Fourth quarter and full year 2021 results. https://investor.fb.com/investor-news/press-release-details/2022/Meta-Reports-Fourth-Quarter-and-Full-Year-2021-Results/default.aspx
Meta for Developers. (n.d.). Conversions API and the dataset quality API. https://developers.facebook.com/docs/marketing-api/conversions-api/dataset-quality-api/
Modern Retail. (2023). How Jones Road Beauty cracked the code on profitability. https://www.modernretail.co/marketing/how-jones-road-beauty-cracked-the-code-on-profitability/
Motion. (2026). Creative benchmarks 2026. https://motionapp.com/thumbstop-pulse/creative-benchmarks-2026
Sanocki, D. (n.d.). Customer value optimization: the three multipliers. Nerd Marketing. https://www.nerdmarketing.com/customer-value-optimization/
Saras Analytics. (n.d.). Ecommerce contribution margin. https://www.sarasanalytics.com/blog/ecommerce-contribution-margin
Shackelford, N. (n.d.). Creative strategy and testing cadence. Foreplay Experts. https://www.foreplay.co/experts/nick-shackelford
Shopify. (n.d.). Average order value: how to calculate and improve it. https://www.shopify.com/blog/average-order-value
Triple Whale. (n.d.). Creative is the new targeting in AI-driven delivery. https://www.triplewhale.com/blog/creative-targeting-ai-driven-delivery
Mayple. (n.d.). True Classic case study. https://www.mayple.com/case-studies/true-classic-tees
About the author: Baptiste Noel, co-founder of Metrikia. MSc in Clinical Neuroscience and MSc in High Performance.