
Baptiste Noel
Growth and co-founder of Metrikia
- Master en neurosciences et neuropsychologies cliniques
- Master en entraînement et optimisation de la performance
- Créateur SaaS et de contenu, 20 000+ abonnés LinkedIn
Co-founder of Metrikia, Baptiste is building a SaaS from scratch and shares the growth journey unfiltered. A former clinical-neuroscience researcher and physical-performance coach, he built then left a coaching business generating over 70,000 EUR per month before focusing on product. He writes about growth strategy, acquisition and scaling.
LinkedInMargin Is the Only Metric: A Rigorous Field Guide to the Numbers Behind Paid Media
CPL, CPA, CAC, ROAS, MER, LTV, contribution margin, cohorts: the rigorous guide to reading, computing and acting on your real numbers, without fooling yourself.
A brand I will not name went bankrupt while growing, and never saw it coming. Every dashboard was green. The ratio everyone quotes on LinkedIn, customer lifetime value divided by acquisition cost, showed a beautiful 4 to 1. The rule says that above 3, you can floor the accelerator. They floored it. They spent more, acquired more customers, watched revenue climb, and eighteen months later the bank account was empty.
The mistake lived in a single line of a spreadsheet. They had computed lifetime value on revenue, not on profit. Each customer did bring in 400 dollars of revenue over their lifetime, but after the cost of the product, shipping, payment fees, and returns, only 120 of margin remained. Their real ratio was not 4 to 1. It was 1.2 to 1. They were buying customers barely above the line where the whole thing turns into a loss, and the accelerator only deepened the fall.
This is the cardinal error of marketing metrics, and it has a name among the people who fund growth. Andreessen Horowitz, one of the most watched funds in Silicon Valley, states it plainly: "a common mistake is to estimate the LTV as a present value of revenue or even gross margin of the customer instead of calculating it as net profit of the customer over the life of the relationship" (Andreessen Horowitz, 2015). Almost everyone reads their numbers wrong, and usually in the direction that flatters. This article is the rigorous guide to those numbers: how to compute them, what each one hides, and why, when you dig all the way down, they all converge on a single truth, margin.
On the menu:
- The cost ladder, from cost per lead to true acquisition cost, and why they are not synonyms.
- ROAS versus MER: the tactical number and the CFO's number.
- The identity 90 percent of advertisers ignore: break-even ROAS equals one divided by your margin.
- The honest way to compute lifetime value, and the ratio you're sold backwards.
- Why the sum of your platforms' ROAS is mathematically wrong.
- What averages destroy, and what cohorts reveal.
The cost ladder: CPL, CPA, CAC
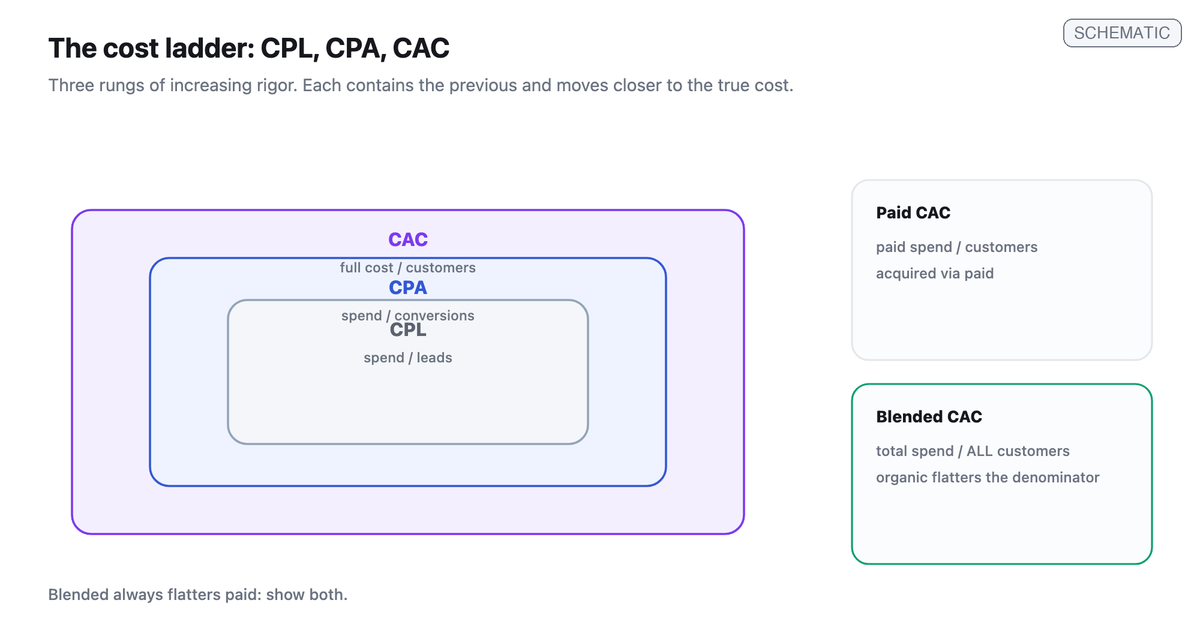
We use these three acronyms as synonyms. They are in fact three rungs of a ladder, each closer to the truth than the last, and the difference is what you put in the numerator and the denominator.
Cost per lead is the simplest: ad spend divided by leads. It measures the cost of the top of the funnel, nothing more. It ignores lead quality and close rate, so a falling cost per lead can just as easily signal deteriorating leads. It is a diagnostic input, never a measure of results.
Cost per acquisition goes one rung down: spend divided by conversions. It is the platforms' native metric, and that is where its bias hides. Its numerator usually contains only media spend, and its denominator counts only the conversions the platform claims for itself. Everything that happens off-platform escapes it.
Customer acquisition cost, CAC, is the grown-up version. Andreessen Horowitz defines it without ambiguity as "the full cost of acquiring users, stated on a per user basis": media, but also agency, creative, salaries, tools. It is the version a CFO looks at. And it splits into two numbers you must never confuse. Paid CAC divides paid acquisition spend by customers from paid channels only: it tells you whether your ad engine is profitable. Blended CAC divides all spend by all new customers, including those from organic, referral, and email. Because the latter enter the denominator at near-zero cost, blended CAC always flatters paid performance. Both are useful, as long as you know which answers which question. Paid CAC judges your ads; blended CAC describes the real economics of the business.
ROAS versus MER: two numbers, two uses
ROAS, return on ad spend, is the revenue attributed to a campaign divided by that campaign's spend. Its fatal flaw is not in the division, it is in the numerator: platform-reported revenue is inflated, for reasons we have taken apart elsewhere, in our article on why the ROAS Meta shows you is wrong. ROAS is still useful for tactical decisions, testing a creative, reallocating between ad sets, but it describes what a channel claims, not what happened.
MER, the marketing efficiency ratio, takes the problem from the top: total revenue divided by total marketing spend. It is also called blended ROAS. Its virtue is structural: it cannot double-count, because it never asks "which channel." It simply divides all the money spent by all the money collected. It is the profit-and-loss number, the one that holds up in front of a board. The nuance most articles miss: strict blended ROAS divides revenue by media spend alone, whereas MER adds agency, tools, and creators, which creates a ten to thirty percent gap between the two depending on the intensity of your non-media costs (Eightx, 2026). Historically, MER is nothing new: it is the pre-digital efficiency ratio, which came roaring back in 2021 precisely because iOS 14.5 broke pixel-level attribution (Digiday). Operator consensus holds that above a few million in revenue, MER becomes the governing number, and ROAS an instrument for tuning. It is also the heart of the distinction we dig into between platform ROAS and CRM-computed ROAS.
The identity almost no one computes: break-even
Here is the most important equation in all of media buying, and the most ignored. Break-even ROAS, the threshold below which you lose money, equals one divided by your gross margin.
It is arithmetic, not opinion. If your margin is 50 percent, you must do at least 2 ROAS to cover your costs. At 30 percent, you need 3.33. At 15 percent, you need 6.67. This simple ratio destroys the most common illusion in the trade, the one that celebrates a ROAS because it "looks good."
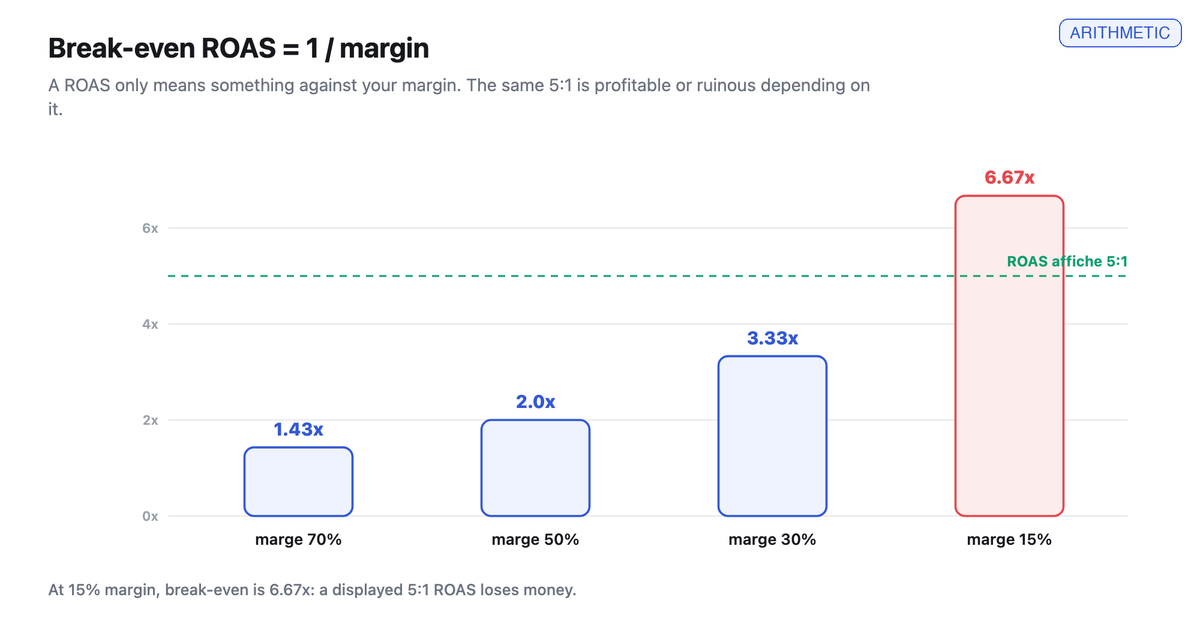
Look at the electronics line. An advertiser selling at 15 percent margin who proudly shows a 5 ROAS is in fact losing money on every sale, because their break-even is 6.67. Two brands can show the exact same 4 ROAS and sit on opposite sides of the waterline, one comfortably profitable at 70 percent margin, the other sinking at 20. ROAS is blind to margin by construction. That is why a simple rule should hang above every dashboard: margin is the only metric. ROAS means nothing except in relation to it. Most direct-to-consumer brands run a true margin of 25 to 35 percent, which means they need a 3 to 4 ROAS just to break even (Saras Analytics).
Computing lifetime value honestly
Back to the brand from the opening. Its error, lifetime value computed on revenue, is so common it deserves its own demonstration. The hierarchy of honesty runs from wrong to right: revenue LTV, which inflates everything; gross-margin LTV, better; and the only correct one, contribution-margin LTV, that is, the customer's net profit.
Andreessen Horowitz's formula is clear. You start from revenue per customer per period, subtract variable costs to get contribution margin, and multiply by the customer's average lifespan, itself equal to one divided by the churn rate. Lifetime value is therefore contribution margin multiplied by lifespan, never gross revenue. David Skok, whose work set the measurement standards for software as a service, reaches the same discipline through another door: lifetime value equals average revenue per account multiplied by gross margin, divided by the churn rate (Skok, 2013). In both cases, margin is locked inside the calculation. Removing it, as our brand did, does not make the number optimistic, it makes it wrong.
The ratio you're sold backwards, and the number that actually counts
Lifetime value divided by acquisition cost is the most quoted and most misused ratio. Its origin is solid: David Skok established 3 to 1 as the viable floor, below which you do not generate enough margin per customer to fund growth. Andreessen Horowitz frames it as a 3 to 1 target over a five-year horizon. But a floor is not a target, and the number is fragile for three reasons. First, lifetime value is a forecast, so a ratio built on wrong churn assumptions is wrong too. Second, it says nothing about time: a 3 to 1 ratio with a twenty-four-month payback can bankrupt you on cash. Third, the right level depends on your cost of capital and your stage: a young brand can rationally run below 3 to 1 to grab share, a mature one should aim higher.
That is why the real number to watch is not the ratio, it is the payback period. It is computed as acquisition cost divided by monthly revenue per customer multiplied by gross margin, and Skok's rule is sharp: under twelve months to stay sustainable, five to seven months for the best. It is the cash-flow metric the lifetime-value-to-acquisition-cost ratio ignores: it answers the one question that governs your short-term survival, how long your money stays locked up before a customer becomes self-funding. A great ratio with a two-year payback still starves cash. For a wider view of these trade-offs, our comparison of cost per lead versus cost per acquisition and our guide to the marketing efficiency ratio extend the subject.
Why the sum of your platforms' ROAS is wrong
Every ad platform is an interested witness claiming credit for the same sale. Add up the revenue Meta, Google, and TikTok each report, and you get a total that exceeds your real revenue by thirty to one hundred percent, commonly thirty to fifty (Eightx, 2026). The mechanism is simple: one buyer sees a Meta ad then clicks a branded Google ad, and both claim the conversion. Google Performance Max blends branded search, which would have converted anyway, with prospecting. And since iOS 14.5, platforms model a share of the conversions they can no longer observe, so the error sometimes runs the other way. That is exactly why you cannot add these numbers: they do not describe the same reality.
The only consistent denominator is the blended one, computed from your own ledger, your store, your payment processor, your bank, not from the platforms. That is why MER and blended CAC are the CFO's numbers: they are the only ones that count the money once.
What averages destroy: cohort analysis
A cohort is a group of customers grouped by acquisition period, then tracked over time. The retention curve plots the percentage of the cohort still buying one, two, three months after the first order. It is the only level at which lifetime value, retention, and even acquisition-cost efficiency take on real meaning, because the aggregate average is a biased artifact. This is Simpson's paradox in action: a trend that holds within every cohort can reverse once the cohorts are aggregated, so an average lifetime value can look stable or rising while each cohort, taken separately, degrades.
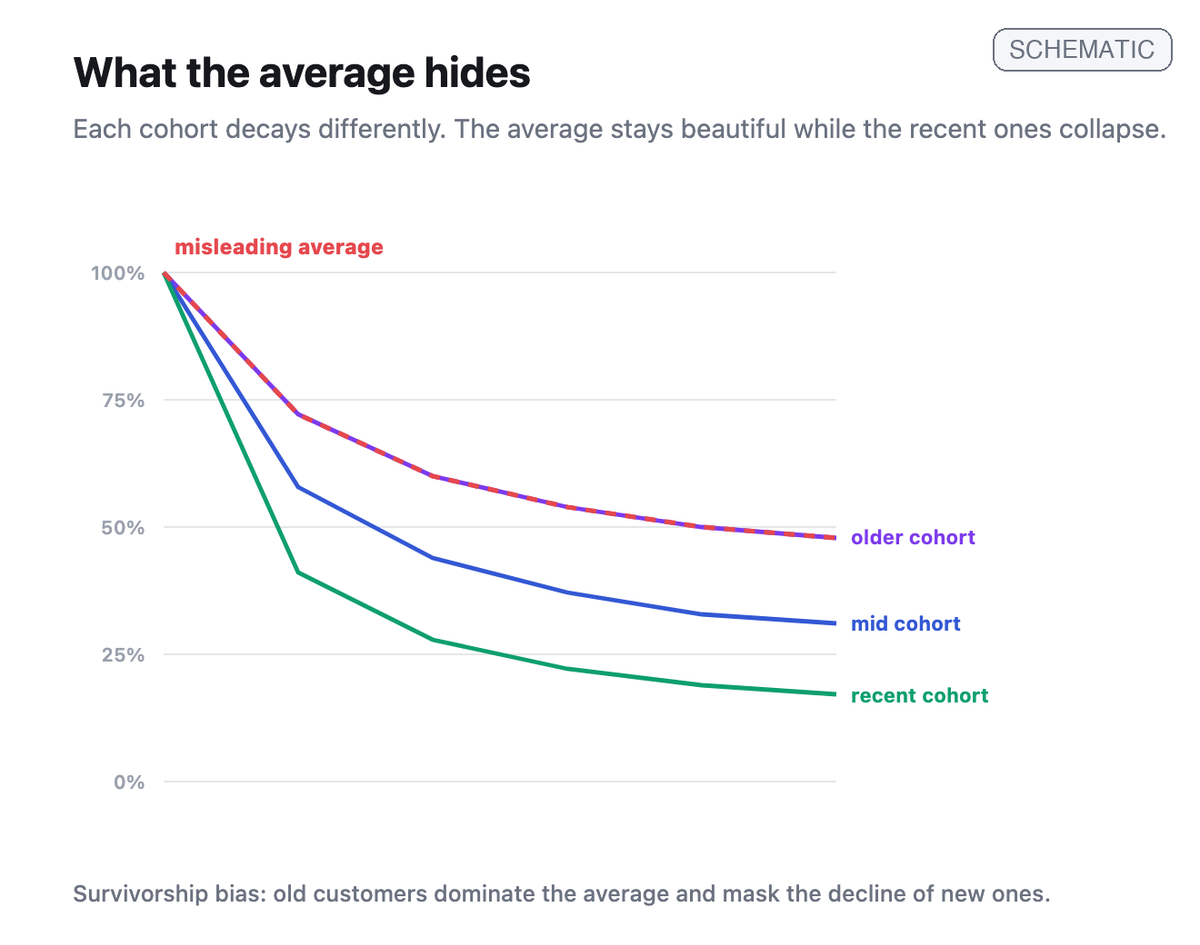
The bias has a name, survivorship bias. Your average lifetime value looks stable while your recent cohorts quietly decay, because the average is dominated by your old loyal customers. A single "28 percent retention" can hide a January cohort at 35 and an August cohort at 18: the average describes no real customer. Promotional cohorts frequently show lifetime value twenty to forty percent lower, invisible in the aggregate number, decisive for your margin. And above all, the shape of a young cohort's curve lets you project its lifetime value before it completes, which is the only credible way to state lifetime value for a young business. The first order is almost always a loss after acquisition cost; profit is earned on later orders, retrieved cheaply through email. Without cohorts, you don't see it.
The reading errors that cost the most
Let us gather the traps in one place, because these are the ones that empty budgets. Computing lifetime value on revenue rather than contribution margin, the cardinal error that inflates everything you think you can spend. Averaging across cohorts, which hides both the decay of new ones and the lower value of promotional ones. Summing platform ROAS, which over-counts your revenue by half. Reading a ROAS without its margin, when break-even equals one divided by margin. Judging your ads on blended CAC, which organic flatters. And optimizing vanity metrics, cost per click, cost per thousand, which are diagnostic instruments, not targets: chasing the cheapest click selects the least intentional traffic. Each of these errors is fixable, but none is visible until you trace back to the cash actually collected.
That is precisely the layer Metrikia is built to be. It reconciles your ad spend to the revenue actually collected in your CRM and payment processor, deduplicates across channels, and surfaces the real metrics, margin, contribution lifetime value, paid CAC, payback, rather than the numbers the platforms give themselves. It does not replace your judgment, it finally gives you the right numbers to exercise it on.
Frequently asked questions
What is the difference between CPL, CPA, and CAC? Cost per lead is spend divided by leads, a top-of-funnel indicator. Cost per acquisition is spend divided by platform-attributed conversions. Customer acquisition cost is the full cost, media plus agency, creative, salaries, tools, divided by new customers. CAC is the reliable version; CPA is only a limited approximation confined to the platform's view.
How do I compute lifetime value correctly? On contribution margin, never on revenue. Andreessen Horowitz's formula is contribution margin per period multiplied by average customer lifespan. Computing lifetime value on revenue is the most common and most dangerous mistake, because it lets you believe you can spend far more than reality to acquire a customer.
Is the 3 to 1 lifetime-value-to-acquisition-cost ratio reliable? It is a floor, not a target. David Skok established it as the viable minimum for funding growth. But it ignores time: a 3 to 1 ratio with a two-year payback can bankrupt you on cash. Watch the payback period, under twelve months per Skok, as much as the ratio itself.
What is break-even ROAS? It is the ROAS below which you lose money, and it equals one divided by your gross margin. At 50 percent margin it is 2; at 30 percent, 3.33; at 15 percent, 6.67. It is an arithmetic identity, not a benchmark. A high displayed ROAS can be below this threshold and therefore unprofitable.
Why can't I add up Meta, Google, and TikTok's ROAS? Because each platform claims the same sale through its own window. The sum of claimed revenue exceeds real revenue by thirty to one hundred percent. The only consistent number is the blended one, computed on your own ledger rather than on the platforms' claims.
Why analyze by cohorts rather than on average? Because the average is survivorship-biased: it is dominated by your old loyal customers and hides the decay of your recent cohorts. A lifetime value, a retention rate, an acquisition cost only mean something at the cohort level. The aggregate average is a lagging artifact that rarely describes a real customer.
If I could keep only one metric, which one? Contribution margin, and everything attached to it: incremental ROAS against break-even, contribution lifetime value against acquisition cost, payback period. Revenue and displayed ROAS are vanity metrics until you anchor them to margin and cash.
References
Andreessen Horowitz. (2015). 16 startup metrics. https://a16z.com/16-startup-metrics/
Andreessen Horowitz. (n.d.). Why do investors care so much about LTV:CAC? https://a16z.com/why-do-investors-care-so-much-about-ltvcac/
Digiday. (n.d.). WTF is marketing efficiency ratio (MER)? https://digiday.com/marketing/wtf-is-mer/
Eightx. (2026). ROAS vs MER vs blended CAC. https://eightx.co/blog/roas-vs-mer-vs-blended-cac
Saras Analytics. (n.d.). ROAS is not profitability: contribution margin revealed. https://www.sarasanalytics.com/blog/roas-vs-contribution-margin-profitability-revealed
Skok, D. (2013). SaaS metrics 2.0: a guide to measuring and improving what matters. forEntrepreneurs. https://www.forentrepreneurs.com/saas-metrics-2/
About the author: Baptiste Noel, co-founder of Metrikia. MSc in Clinical Neuroscience and MSc in High Performance.