
Baptiste Noel
Growth and co-founder of Metrikia
- Master en neurosciences et neuropsychologies cliniques
- Master en entraînement et optimisation de la performance
- Créateur SaaS et de contenu, 20 000+ abonnés LinkedIn
Co-founder of Metrikia, Baptiste is building a SaaS from scratch and shares the growth journey unfiltered. A former clinical-neuroscience researcher and physical-performance coach, he built then left a coaching business generating over 70,000 EUR per month before focusing on product. He writes about growth strategy, acquisition and scaling.
LinkedInThe biggest media-buying mistake: scaling on a ROAS that was never measured (what three experiments prove)
The real media buying mistake is not creative or targeting. It is scaling on a ROAS nobody ever measured. The evidence, and the one-line test.
In 2012, eBay decided to test something nobody in advertising really dared to. The company was spending tens of millions of dollars a year on Google ads for its own brand keywords, the ads that appear when someone types "eBay" into the search bar. The dashboard was beautiful: every dollar spent came back, again and again, as attributed sales. On paper, cutting those campaigns would have been insane.
They cut them anyway, in a large-scale controlled experiment. And nothing happened. Traffic to eBay barely moved: the people who searched "eBay" and used to click the paid ad now clicked the organic result right below it. The paid clicks were not creating sales. They were repurchasing sales that were going to happen anyway. The researchers who ran the study, published in Econometrica, calculated the real return on those search campaigns: an average ROI of minus 63 percent (Blake, Nosko & Tadelis, 2015). Not a disappointing return. A negative one, on campaigns every dashboard graded among the most profitable in the account.
It is the most uncomfortable story in media buying, and it has not aged a day. Because most articles that promise to list "the mistakes killing your ROI" talk about creative fatigue, broad targeting, untested landing pages. Those are real mistakes. But they are rounding errors next to the one the eBay experiment exposed: you may be meticulously optimizing campaigns against a number that never measured what you think it does. This article is about that mistake, the only one that makes all the others secondary.
The five mistakes everyone repeats (and why they are not the real subject)
Open any guide on media-buying mistakes and you will find the same list, give or take the order. It is not wrong. It is just shallow.
| The classic mistake | What you're told | Why it isn't the root |
|---|---|---|
| Relying on one channel | Diversify beyond Meta | True, but says nothing about whether your numbers are reliable |
| Creative fatigue | Refresh your creatives often | Optimizes the top of the funnel, not the measurement of the result |
| Poor targeting | Tighten your audiences | Improves a number you may be reading wrong |
| Not testing | Run continuous A/B tests | You're testing against a biased metric |
| Flying blind | Watch your campaigns closely | Watching the wrong indicator doesn't make it true |
Each of these is worth fixing. But they all share a silent assumption: that the number at the end, the ROAS, the cost per acquisition, the conversion count, faithfully describes reality. Remove that assumption and the whole list collapses. You can have the best creative, the sharpest targeting, an impeccable testing protocol, and scale straight into a wall, because the compass you're aligning to points slightly off true north. That is the real subject.
The real mistake: you scale on a number that was never measured
We have to be precise about what's wrong, because the problem is not that platforms lie. It is structural, and it fits in one sentence: the ROAS Meta or Google shows you is an assertion, not a measurement. It is produced by the system that sells the ad space, which decides by its own rules which sales to claim, and which profits when that credit looks large. No independent auditor is in the loop, unless you put one there. This is Goodhart's law applied to advertising: once a measure becomes a target, it stops being a good measure. The day reported ROAS becomes the number to maximize, optimization starts serving the figure rather than the reality it was meant to describe.
From that structure flows a chain of leaks, and each one moves the displayed number a little further from the money that actually landed in your account.
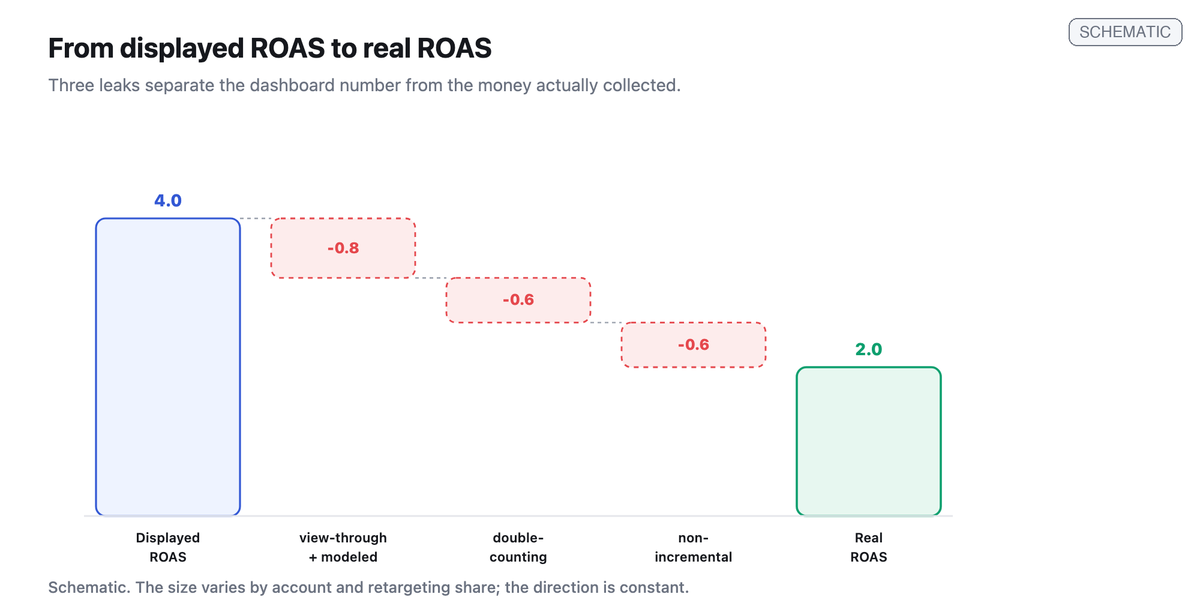
The first leak is the inflation of the number itself. Meta's default attribution window credits view-through conversions: someone sees your ad, doesn't click, buys the next day, and the sale is counted as caused by the ad. Because the algorithm shows your ads to the people most likely to buy, that view-through credit attaches the ad to sales that were probably going to happen anyway. On top of that come modeled conversions: since iOS 14.5, a share of conversions is no longer observed but statistically estimated, then displayed in the same green tile as a real sale. We take that mechanism apart in detail in our article on why the ROAS Meta shows you is wrong.
The second leak is cross-platform double-counting. One customer sees a TikTok ad, gets retargeted by Meta, searches your brand on Google, then buys once. One order leaves the warehouse. But each platform, looking only at its own touch through its own window, claims that conversion. Add up the three dashboards and you have sold three units when your warehouse shipped one. This is why the sum of platform-claimed revenue routinely exceeds your real revenue, and it's a problem no platform is incentivized to solve for you. The only way out is to start from your own source of truth and deduplicate across channels.
The third leak is the deepest: attribution is not incrementality. Attributing a sale answers the question "who touched it last." Your profit and loss cares only about a different question: "would this sale have happened without the ad." The eBay experiment answered that question brutally for brand search. Only a controlled test, a holdout, can answer it for your campaigns, and it's an incrementality test that provides it, never a dashboard.
The evidence: what experiments say, not opinions
What makes this subject different from the usual marketing debates is that it was settled by rigorous experiments, on the platforms' own data, before anyone had an interest in spinning the result.
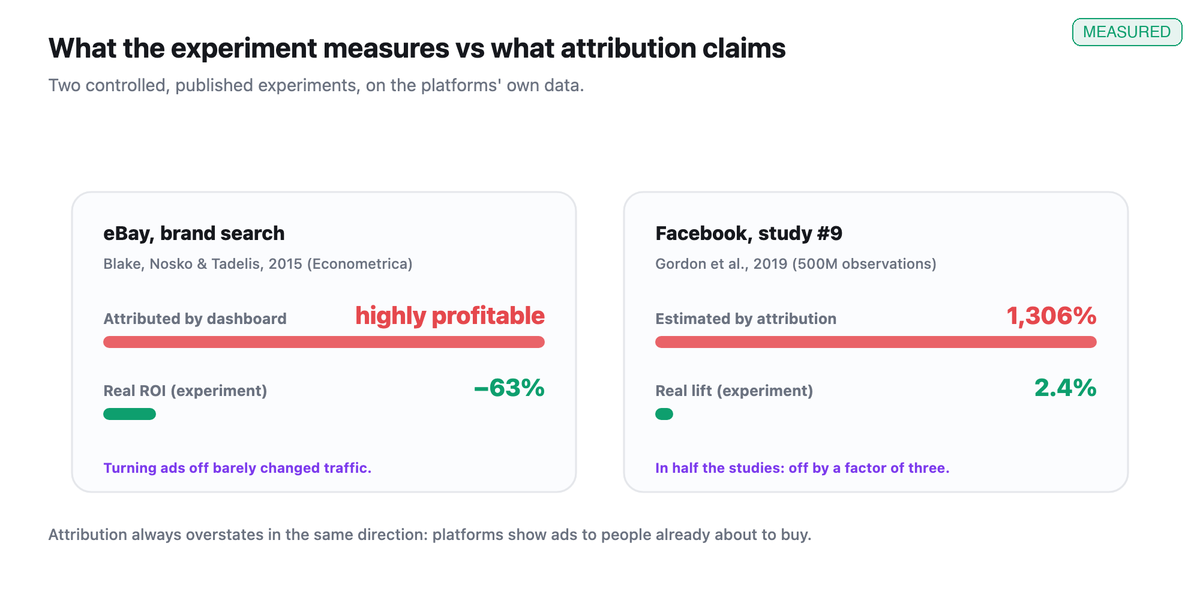
The largest study was run on Facebook itself. Gordon and his coauthors compared, across fifteen randomized controlled experiments, roughly 500 million observations and 1.6 billion impressions, the real causal effect of ads against the number that standard attribution methods produce on the very same data. Their conclusion, word for word: in half of the studies, the estimated increase in purchases was off by a factor of three, across all methods (Gordon et al., 2019). In one extreme case, study number 9, the real effect measured by the experiment was 2.4 percent when the observational method reported 1,306. The bias always runs the same way: attribution overstates, because platforms show ads to the people already most inclined to convert.
Add the eBay experiment and its real ROI of minus 63 percent on brand search, and the picture is complete. These are not consultancies selling a fix. They are economists, published in the most demanding journals, who measured the gap between what dashboards assert and what advertising actually causes. The method that isolates that effect, by quietly logging the ad that would have been shown to a control group without showing it, is called ghost ads, and it is now the backbone of serious incrementality, all the way to operators like DoorDash (Johnson, Lewis & Nubbemeyer, 2017).
A word to defuse a common counter-objection. No, the problem is not that "CPMs are exploding" and you just need to spend better. Across tens of billions of impressions, Meta's CPM rose only about 1 percent year over year, and Google's about 2.4 percent (Gupta Media, 2025). The cost of attention has not run away. It's the measurement of its return that is broken.
The link nobody watches: ROAS versus margin
Even assuming your ROAS were perfectly measured, it would still be blind to one thing: your margin. A ROAS doesn't know whether you sell software at 90 percent margin or electronics at 15. Yet a campaign's break-even point is mechanical: it equals one divided by your margin. At 45 percent margin, you only turn a profit above a real ROAS of 2.2. The trap snaps shut when you combine the two errors: a displayed ROAS of 4, deflated by the documented inflation factor, often lands around 2 in true incremental terms, that is, below your break-even. The campaign you were proudly scaling was losing money on every extra euro. The lesson is not to chase a high ROAS, but to compare your incremental ROAS to your margin threshold, never your displayed ROAS to a vanity target.
The one-line test
There is a simple diagnostic any media buyer can run this month with no tool at all. Take the revenue each platform claims, add them up, and divide by the cash you actually collected over the same period, the money on your bank statement or in your payment processor.
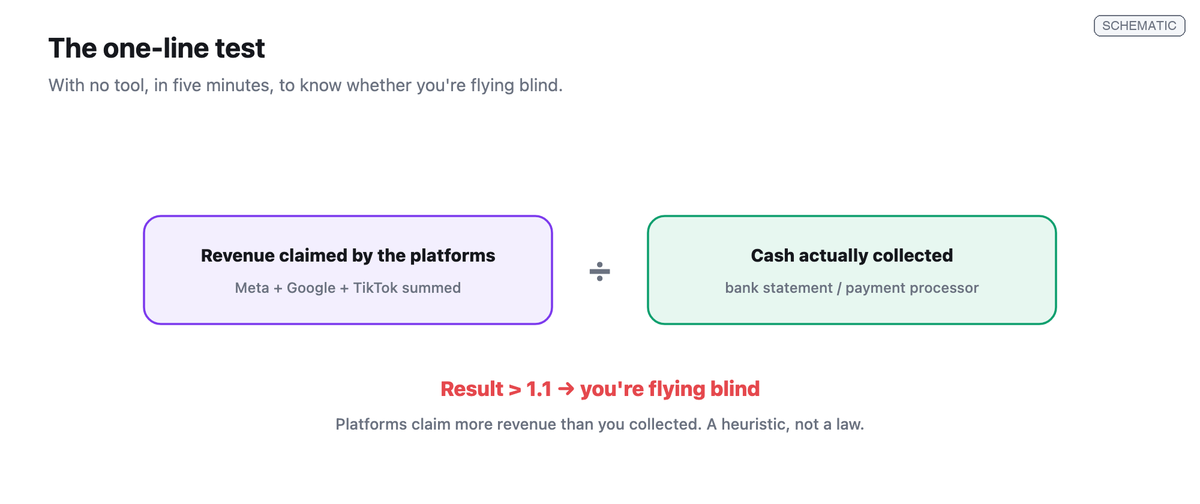
If the result is above 1.1, you're flying blind: your platforms together claim more revenue than you collected, and the difference is exactly the margin of error your budget decisions rest on. It's not a law, it's a heuristic, but it has the merit of making the problem tangible in five minutes. Most accounts that run the exercise for the first time discover a gap they never suspected.
How to get out of the illusion
The answer is not one more dashboard. It's a different source of truth. The displayed number is anchored to the platform's view of conversions; the real number has to be anchored to two things the platform cannot see: the money actually collected, and what would have happened without the spend.
The first anchor is accounting and entirely doable. Every sale lives in your CRM or payment processor as collected cash, attached to a real customer. The work is to match each of those real sales back to the campaign that sourced it, then divide real revenue by real spend. That single move eliminates modeled conversions, view-through credit, and most of the double-counting in one pass, because you're now counting orders that shipped, not conversions that were claimed. It's exactly the verification layer our guide to building a complete tracking system describes, and it's the lane Metrikia was built for: reconciling ad spend to the revenue actually collected, deduplicating across channels, and laying an AI analysis layer on top that reads those real numbers for you.
The second anchor, what would have happened anyway, no accounting will give you, because it's a causal question. It takes a holdout: turn spend off for a defined audience or region, watch whether sales really drop, measure the difference. The best-run measurement uses reconciliation to cash as the daily truth, and a periodic holdout to validate the big bets.
Fix your creative, tighten your targeting, test your landing pages. Those mistakes are worth fixing. But do it while steering by a real number. The worst outcome is not a mediocre campaign, well measured. It's a perfect campaign optimized against a number that was never there.
Frequently asked questions
What is the biggest media-buying mistake? It's not creative, targeting, or budget. It's scaling on a platform-reported ROAS without ever reconciling it to the revenue actually collected. Controlled experiments show that standard attribution overstates the real effect of advertising, sometimes by a factor of three (Gordon et al., 2019), which skews every downstream decision.
Why is my ROAS good while my bank account doesn't follow? Because the displayed ROAS counts view-through conversions, modeled conversions, and sales also claimed by other platforms, and because it ignores your margin. A high displayed ROAS can hide an incremental ROAS below your break-even. The only reliable number is computed from the cash you actually collected.
Is the eBay experiment still relevant today? Yes. The mechanism it revealed, paid search repurchasing sales already won through organic, hasn't changed. It remains one of the few published experimental proofs, in Econometrica, of the gap between attributed and real ROI (Blake, Nosko & Tadelis, 2015).
How do I know in five minutes whether my numbers are wrong? Add up the revenue each platform claims and divide it by the cash collected over the same period. If the ratio is above roughly 1.1, your platforms are over-counting, and you're steering by an inflated number. It's a diagnostic, not a law, but it makes the gap visible immediately.
Should I stop looking at Meta's ROAS? No. In-platform ROAS is still useful for day-to-day tactical decisions, testing creatives, reallocating between ad sets. The mistake is making it the basis of your budget and scaling decisions. For that, you need a number anchored to cash and validated by a holdout.
References
Blake, T., Nosko, C., & Tadelis, S. (2015). Consumer heterogeneity and paid search effectiveness: A large-scale field experiment. Econometrica, 83(1), 155-174. https://doi.org/10.3982/ECTA12423
Gordon, B. R., Zettelmeyer, F., Bhargava, N., & Chapsky, D. (2019). A comparison of approaches to advertising measurement: Evidence from big field experiments at Facebook. Marketing Science, 38(2), 193-225. https://doi.org/10.1287/mksc.2018.1135
Gupta Media. (2025). Social media advertising cost benchmarks. https://www.guptamedia.com/social-media-ads-cost
Johnson, G. A., Lewis, R. A., & Nubbemeyer, E. I. (2017). Ghost ads: Improving the economics of measuring online ad effectiveness. Journal of Marketing Research, 54(6), 867-884. https://doi.org/10.1509/jmr.15.0297
About the author: Baptiste Noel, co-founder of Metrikia. MSc in Clinical Neuroscience and MSc in High Performance.