
Baptiste Noel
Growth and co-founder of Metrikia
- Master en neurosciences et neuropsychologies cliniques
- Master en entraînement et optimisation de la performance
- Créateur SaaS et de contenu, 20 000+ abonnés LinkedIn
Co-founder of Metrikia, Baptiste is building a SaaS from scratch and shares the growth journey unfiltered. A former clinical-neuroscience researcher and physical-performance coach, he built then left a coaching business generating over 70,000 EUR per month before focusing on product. He writes about growth strategy, acquisition and scaling.
LinkedInWhy the ROAS Meta Shows You Is Wrong (and How to Calculate the Real One)
Meta's ROAS is a claim, not a measurement. The three mechanisms that inflate it, and how to compute the real one your budget can actually trust.
You open Business Manager, you see a 4.2x ROAS, and something in you relaxes. The number is green, it is specific, it has a decimal point. It feels like proof. It is not proof. It is a claim, and the party making the claim is the same party you are paying, graded by a scoreboard that party keeps itself.
That is the whole problem in one sentence, and almost every reporting mistake media buyers make downstream is a consequence of it. The ROAS Meta shows you was never measured against your bank account. It was asserted by the system that serves the impression, decides which sales to take credit for, and profits when that credit looks large. None of that makes Meta dishonest. It makes the number structurally optimistic, and optimism compounds when you scale against it.
This is not a piece about distrusting platforms on principle. Meta's Marketing API is one of the most useful data sources a marketer has. It is a piece about reading one specific number correctly, because it is the number your budget decisions depend on. So let us take it apart. First, why the reported figure is a claim and not a measurement. Then the three mechanisms that inflate it, one at a time, with the actual machinery rather than vibes. Then the single best piece of evidence we have for how big the gap can get. And finally, how to compute the ROAS you can actually trust, which is the only one worth scaling against.
The number is a claim, not a measurement
Start with the structure, because the structure explains everything that follows. When a sale happens, two questions can be asked about it. The first is "who touched this customer last." The second is "would this sale have happened anyway, without the ad." These are different questions. Attribution answers the first. Your profit and loss cares only about the second. Meta's reported ROAS is built entirely on the first question and quietly presented as if it answered the second.
Worse, Meta is both a participant and the referee. It serves the impression, it observes the conversion through its pixel or Conversions API, and it decides, using its own rules, whether to claim that conversion as caused by the ad. A scoreboard kept by the player rarely shows a loss. This is not a conspiracy. It is an incentive structure. The default settings are generous, the methods that fill gaps lean toward crediting the platform, and there is no independent auditor in the loop unless you put one there.
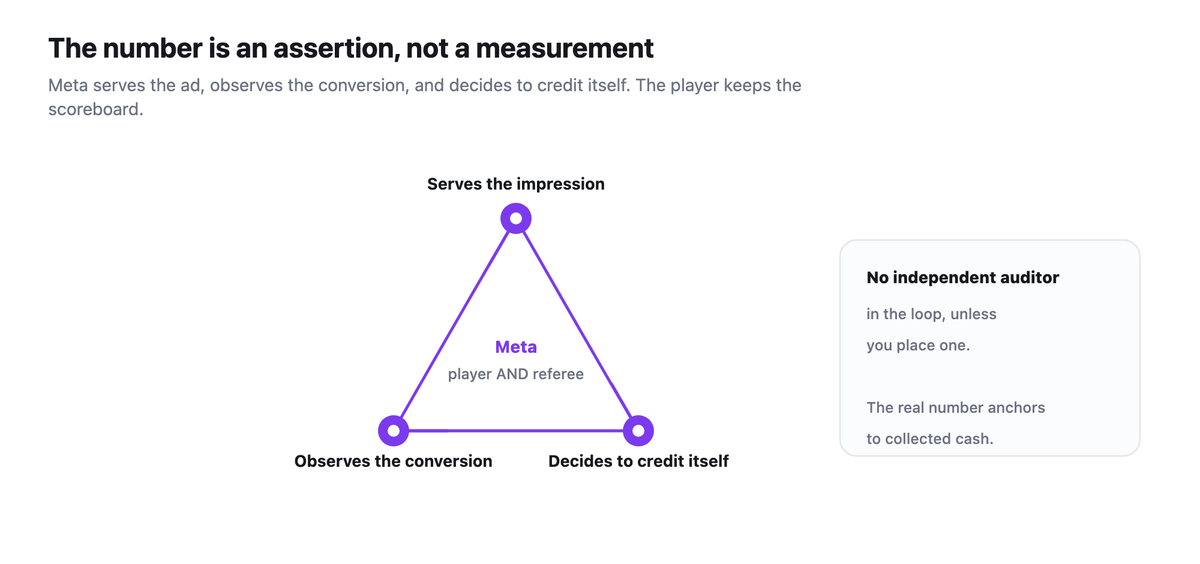
So when you read 4.2x, what you are actually reading is: "under our own attribution rules, with our own windows, including conversions we modeled rather than observed, and without checking whether any of these buyers would have purchased anyway, we estimate a 4.2x return." That is a very different sentence than "every euro you gave us came back 4.2 times." The gap between those two sentences is the subject of this article.
Mechanism one: the default attribution window
The first source of inflation is the attribution window, and it is the one most media buyers have never looked at. Meta's default attribution setting for new ad sets is 7-day click and 1-day view (Meta Business Help Center, n.d.-a). That phrase carries more weight than it looks.
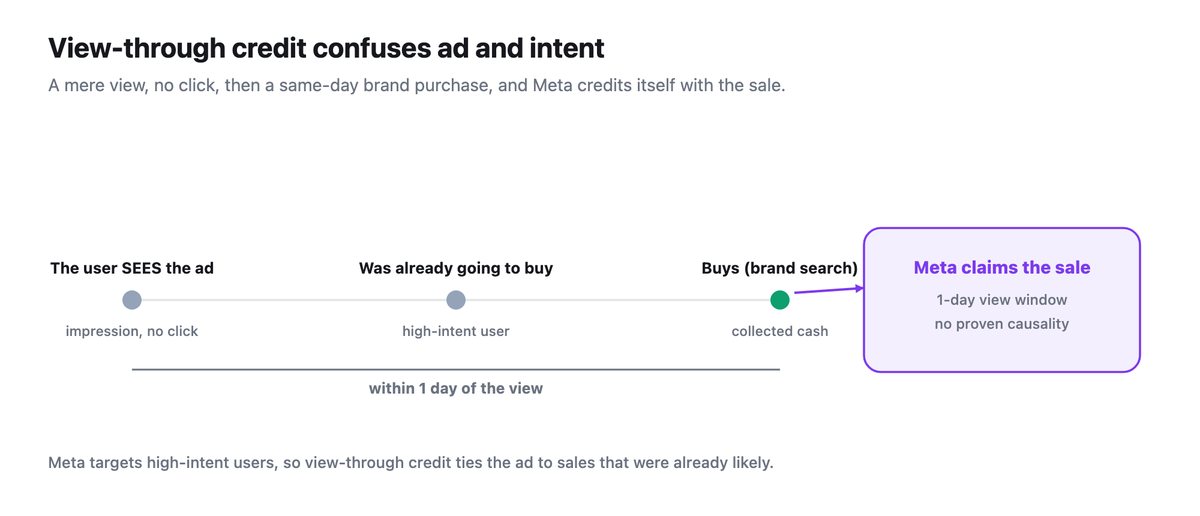
The 7-day click portion means any purchase within seven days of a click gets credited to the ad. The 1-day view portion is the quieter problem. It means that if a user merely sees your ad, does not click, and then buys within one day by typing your URL directly or searching your brand, Meta claims that sale. No click. No demonstrated intent caused by the ad. Just an impression that happened to precede a purchase the customer may well have made regardless.
This matters because of who sees your impressions. Meta's delivery optimization shows your ads to the people most likely to convert, which by construction includes people already moving toward a purchase. View-through credit then attaches the ad to conversions that were the most likely to happen anyway. The ad and the intent are confounded, and the reported number cannot tell them apart.
One historical note worth carrying with you. Before 2021, Meta's default window went all the way out to 28-day click. Apple's App Tracking Transparency, which arrived with iOS 14.5 on April 26, 2021, forced Meta to retire the longer windows and fall back to 7-day click and 1-day view (Peters & Statt, 2021). So if you read an old guide telling you the default is 28 days, it is out of date. The window got shorter, which trimmed some inflation, but the view-through mechanism that confounds ads with organic intent is still switched on by default.
Mechanism two: modeled, not observed
The second mechanism is more recent and less understood. Since iOS 14.5 made device-level identifiers opt-in, Meta can no longer directly observe a large share of conversions for users who declined tracking. It did not respond by reporting fewer conversions. It responded by estimating the missing ones.
The system is Aggregated Event Measurement, and the relevant fact for you is simple: a portion of the conversions in your Ads Manager were never counted as discrete events. They were modeled, which is to say statistically inferred from aggregate patterns (Meta Business Help Center, n.d.-b). Modeling is a reasonable engineering response to a measurement blackout. It is also, from your seat, a number with a confidence interval that is being displayed to you as if it were a hard count.
The consequence is subtle but real. When you optimize against modeled conversions, you are partly optimizing against Meta's estimate of what probably happened, inside a model whose assumptions you cannot see and cannot audit. The figure is not fabricated. It is inferred. But inference dressed in the same green tile as an observed sale invites you to treat the two as equally solid, and they are not. Wire that number into an automatically updating AI dashboard and you have not made it more accurate, only faster and harder to doubt.
Mechanism three: everyone claims the same sale
The third mechanism only appears when you run more than one channel, which is to say almost always. Meta, Google, and TikTok each run their own last-touch and view-through self-attribution, and each uses its own windows.
| Platform | Default window | What it tends to over-credit |
|---|---|---|
| Meta | 7-day click, 1-day view | View-through conversions, where the user only saw the ad |
| Google Ads | 30-day click | Brand search, at the end of the journey |
| TikTok | 7-day click, 1-day view | Top of funnel, on a younger audience |
Now picture one real customer. They see your TikTok ad on Monday, get retargeted by Meta on Wednesday, search and click your Google ad on Friday, and buy. One order ships. One payment hits your account. But each platform, looking only at its own touch through its own window, claims that conversion. Add up the three dashboards and you have sold three units. Your warehouse shipped one.
This is why summing platform-reported conversions is one of the fastest ways to lie to yourself. The double counting is not a bug in any single platform. Each one is correct on its own terms. The error is structural, it lives in the gaps between three self-graded scoreboards, and no single platform has any incentive to resolve it in your favor. The only way to count an order once is to start from your CRM and deduplicate across channels.
From reported to real: walking the number down
Put the three mechanisms together and you get a bridge from the reported number to the real one. Start at the top with the reported ROAS. Subtract the view-through conversions that would have happened without the ad. Subtract the buyers who already knew your brand and were credited anyway. Subtract the conversions double counted with your other channels. Adjust for the share that was modeled rather than observed. What is left at the bottom is the figure that ties to your actual revenue.
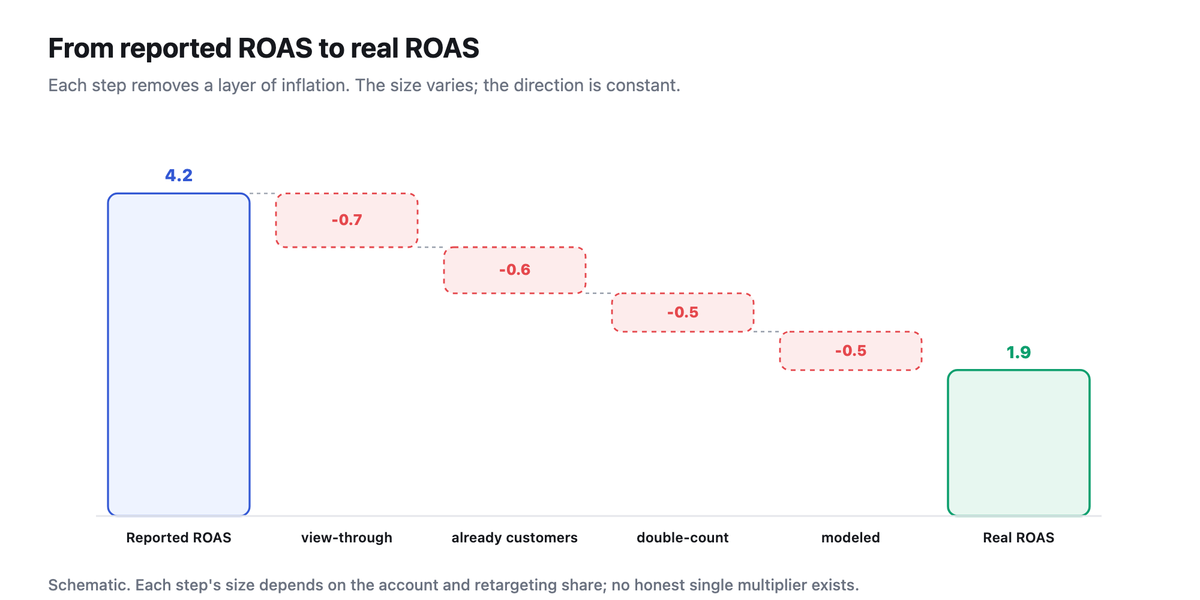
The exact size of each step varies by account, funnel stage, and how much of your spend is retargeting versus prospecting. That variation is precisely why no honest article can hand you a single multiplier and tell you "Meta inflates by X percent." Anyone who does is selling you false precision. What is true is the direction, which is always the same, and the order of magnitude, which we can ground in real evidence rather than assertion.
The best evidence we have: attribution versus incrementality
Here is the study that should anchor your intuition. Gordon, Zettelmeyer, Bhargava, and Chapsky (2019) ran fifteen large-scale randomized controlled trials on Facebook itself, roughly 500 million user-experiment observations across 1.6 billion impressions, and compared the true causal lift measured by the experiments against the lift that standard attribution-style methods reported on the very same data.
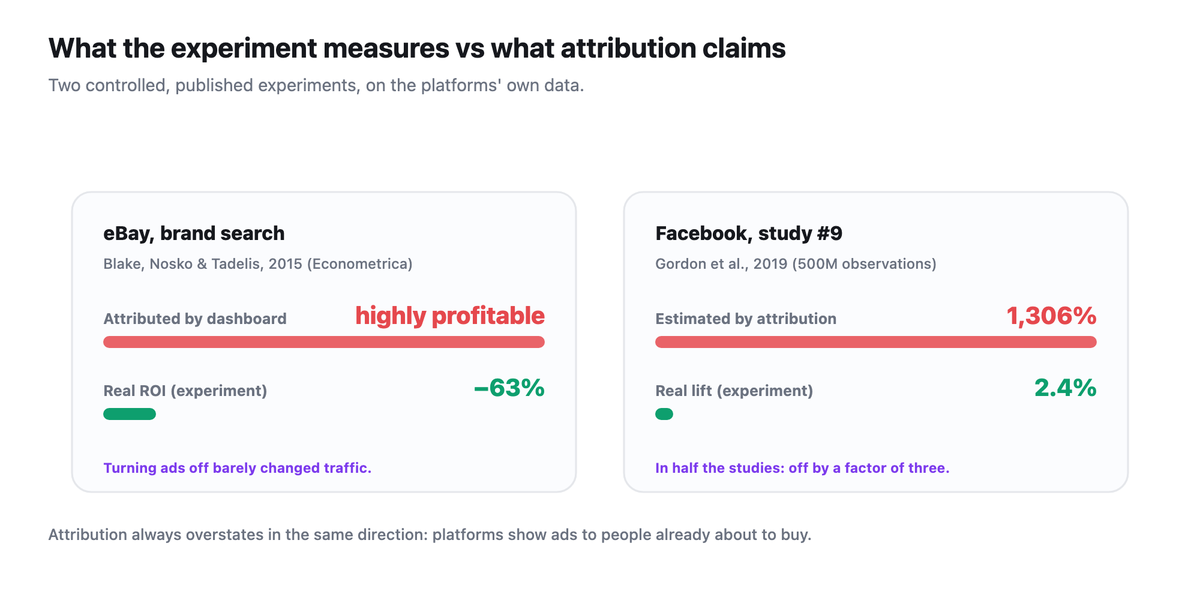
The results are stark. Across these fifteen experiments, roughly 500 million observations and 1.6 billion impressions, the authors conclude, word for word, that in half of the studies the estimated increase in purchases is off by a factor of three, across all attribution methods. In one extreme case, study number 9, the real effect measured by the experiment was 2.4 percent when the observational method reported 1,306. The bias always runs the same way: attribution overstates, because platforms show ads to the people already most inclined to convert, and the overstatement is largest where performance budgets concentrate, at the bottom of the funnel and on retargeting (Gordon et al., 2019).
Sit with the implication. The gap is not a rounding error. On the platform's own data, with rigorous experiments as the benchmark, the attribution view of performance was off by a multiple, not a margin. And it was variable, sometimes even understating, which is the deeper point. You cannot correct reported ROAS with a fixed discount, because there is no fixed bias. The only way to know your real number is to measure it.
Meta knows this, which is the quiet tell. The reason Conversion Lift exists, and the reason Meta added an Incremental Attribution setting, is that the company concedes standard attribution counts conversions that would have happened anyway. Worth knowing: Incremental Attribution is itself modeled, trained on past Conversion Lift studies rather than a live holdout, so it is an estimate of incrementality and not a measurement of it (Seer Interactive, 2025). When even the platform ships a feature to walk its own number back, you should read the original number with suspicion.
What the real number actually requires
So what does it take to get to a ROAS you can scale against. Not more dashboards. A different source of truth. The reported number is anchored to Meta's view of conversions. The real number has to be anchored to two things Meta cannot see: the revenue that actually landed in your account, and the question of what would have happened without the spend. This is exactly the verification layer our guide to building a complete tracking system describes, and it is the heart of the gap between the platform ROAS and the ROAS computed on cash.
The revenue side is mechanical and entirely doable. Every sale lives in your CRM or your payment processor as collected cash, attached to a real customer. The job is to match each of those real sales back to the campaign, ad set, and ad that actually sourced it, then divide real revenue by real spend. That single move strips out the modeled conversions, the brand searches credited to view-through, and most of the cross-platform double counting in one pass, because you are now counting orders that shipped rather than conversions three platforms claimed.
This is the layer Metrikia is built to be. It pulls your spend from Meta, Google, and TikTok, ingests revenue from your CRM and payment stack as the source of truth rather than the platforms' estimates, matches each sale to its real originating campaign, deduplicates across channels so one order is one order, and lets you hold the attribution window honest instead of accepting a generous default. The output is a ROAS computed from money you actually collected, not from a scoreboard the seller keeps. You can read it next to the platform number and see the gap for yourself, per campaign, which is the only version of this comparison that changes decisions.
The second anchor, what would have happened anyway, attribution alone can never give you, because it is a causal question. The honest answer is a holdout: turn the spend off for a defined audience or region, watch whether sales actually fall, and measure the difference. That is incrementality, and it is the only thing that survives the scrutiny the reported number cannot. Reconciliation to collected cash gets you an honest accounting number. A holdout gets you a causal one. Serious measurement uses reconciliation as the daily ground truth and a holdout to validate the big moves.
How to compute your real ROAS
The order of operations matters more than any single step, so here it is as a sequence you can run.
First, pull spend from every channel, not just the one with the prettiest dashboard. Second, take revenue from your CRM or payment processor, collected cash, not platform-reported conversion value. Third, match each sale to its real originating campaign so the numerator and denominator describe the same thing. Fourth, deduplicate across channels so a single order is never counted by Meta and Google and TikTok at once. Fifth, set the attribution window deliberately rather than accepting 7-day click and 1-day view by default, and be especially skeptical of view-through credit. Sixth, validate your largest bets with a holdout test, because no amount of careful accounting answers the causal question. Only then read your ROAS, and scale against that number rather than the one Business Manager hands you.
The reward for doing this is not just a more accurate report. It is different decisions. When the real number diverges from the reported one, the campaigns you would have scaled on platform ROAS are frequently not the campaigns that are actually growing the business, and the gap is largest in retargeting, which is exactly where reported ROAS looks most seductive. Measuring correctly does not just clean up the spreadsheet. It reallocates budget toward what is genuinely working, a point we dig into in the piece on the gap between real and reported ROAS.
Frequently asked questions
What is the difference between reported ROAS and incremental ROAS on Meta? Reported ROAS answers "who touched this sale last," counting every conversion Meta's attribution rules credit to the ad. Incremental ROAS answers "would this sale have happened without the ad," counting only the additional revenue the ad actually caused. The first is an attribution claim; the second is a causal measurement. Your profit and loss only responds to the second.
What is Meta's default attribution window, and why does it inflate conversions? The current default for new ad sets is 7-day click and 1-day view (Meta Business Help Center, n.d.-a). The 1-day view portion credits the ad when a user merely saw an impression, did not click, and then bought within a day, often a customer who was already going to purchase. Because Meta shows impressions to high-intent users, view-through credit systematically attaches the ad to conversions that were the most likely to happen anyway.
Does view-through attribution really cause sales, or just take credit for them? Sometimes a view genuinely contributes. But view-through cannot distinguish a sale the impression caused from a sale that would have happened regardless, and because of how Meta targets, a large share of view-through conversions fall into the second category. Treat view-through credit as the least reliable part of your reported number.
Why do Meta, Google, and TikTok together report more conversions than I actually had? Because each platform runs its own self-attribution with its own window and claims any order it touched. One customer touched by all three produces one shipped order but three claimed conversions. Summing platform dashboards therefore overstates real sales. The fix is to count orders from your own CRM or payments, deduplicated, not conversions from three scoreboards.
What are modeled conversions, and how did iOS 14.5 change measurement? Apple's App Tracking Transparency, launched with iOS 14.5 on April 26, 2021, made tracking identifiers opt-in, so Meta lost the ability to directly observe many conversions (Peters & Statt, 2021). It now statistically estimates the missing ones through Aggregated Event Measurement (Meta Business Help Center, n.d.-b). A share of the conversions you see were modeled, not observed, and carry uncertainty that the interface does not display.
How much does Meta's reported ROAS overstate the real one? There is no fixed number, and anyone quoting a single percentage is selling false precision. In Facebook's own randomized experiments, standard attribution overstated true incremental lift by roughly two to three times on average, with the bias largest for lower-funnel and retargeting campaigns and highly variable across accounts (Gordon et al., 2019). The direction is consistent; the magnitude is not.
Is Meta's new Incremental Attribution setting the same as a real incrementality test? No. Incremental Attribution is modeled, trained on past Conversion Lift studies rather than run as a live holdout, so it estimates incrementality rather than measuring it (Seer Interactive, 2025). It is a step in the right direction conceptually, but it is still Meta estimating its own incrementality. A holdout you control is the standard that actually settles the question.
What does it cost to measure real ROAS properly versus the free dashboard? The platform dashboard is free and wrong in a predictable direction. Reconciling to collected cash requires connecting your ad accounts and your CRM or payment processor to a measurement layer, which is a setup cost measured in hours and a subscription, not a rebuild. The relevant comparison is not the tool's price against zero. It is the tool's price against the budget you misallocate every month by scaling on an inflated number.
References
Gordon, B. R., Zettelmeyer, F., Bhargava, N., & Chapsky, D. (2019). A comparison of approaches to advertising measurement: Evidence from big field experiments at Facebook. Marketing Science, 38(2), 193-225. https://doi.org/10.1287/mksc.2018.1135
Meta Business Help Center. (n.d.-a). About the attribution setting. https://www.facebook.com/business/help/458681590974355
Meta Business Help Center. (n.d.-b). How Meta's Aggregated Event Measurement may affect the Meta Pixel. https://www.facebook.com/business/help/126789292407737
PantoSource. (2026). Cross-platform attribution in 2026: Why Meta plus Google plus TikTok does not equal your actual sales. https://pantosource.com/blog/multi-platform-attribution
Peters, J., & Statt, N. (2021, April 26). Apple's App Tracking Transparency feature has arrived. TechCrunch. https://techcrunch.com/2021/04/26/apples-app-tracking-transparency-feature-has-arrived-heres-what-you-need-to-know/
Seer Interactive. (2025, July 30). We tested Meta's new incremental attribution setting on 1M dollars in ad spend. https://www.seerinteractive.com/insights/we-tested-metas-new-incremental-attribution-setting-on-1m-in-ad-spend.-heres-how-it-works
About the author: Baptiste Noel, co-founder of Metrikia. MSc in Clinical Neuroscience and MSc in High Performance.