
Baptiste Noel
Growth and co-founder of Metrikia
- Master en neurosciences et neuropsychologies cliniques
- Master en entraînement et optimisation de la performance
- Créateur SaaS et de contenu, 20 000+ abonnés LinkedIn
Co-founder of Metrikia, Baptiste is building a SaaS from scratch and shares the growth journey unfiltered. A former clinical-neuroscience researcher and physical-performance coach, he built then left a coaching business generating over 70,000 EUR per month before focusing on product. He writes about growth strategy, acquisition and scaling.
LinkedInYour Client Stopped Believing Your ROAS. And They're Right.
Your ad platforms inflate your ROAS and your client feels it. The 4-step protocol to prove your real ROAS to a client, evidence in hand, without losing the account.
For years, everyone in advertising believed one simple thing. Someone clicks your ad, then they buy: the ad made the sale. It is intuitive. It is also the foundation of every ROAS number you have ever put in front of a client.
In 2015, eBay's own economists decided to find out for sure. They shut off their own Google ads across a third of the United States, chosen at random, and left them running everywhere else. Then they compared the two halves of the country on a single question: did the regions without ads actually sell less?
The result: almost no difference. The buyers who were supposed to come from the ads showed up anyway, through organic search. On branded keywords, 99.5% would have arrived without eBay paying a cent. For every dollar poured into those ads, the company got back barely thirty-seven cents.
eBay was paying to appear in front of people already walking to the checkout, then signing their visit as a win.
Nobody says this out loud on a client call. Your dashboard adds up the sales the ad merely crossed paths with and claims them all. Your client, sooner or later, will ask the question. And on that day, eBay will have done to its own ads what your client dreams of doing to you: put them on trial, with real evidence, not a screenshot.
To prove your ROAS to a client, start from their real revenue (Stripe or Shopify), never the platform numbers. Compare what Meta, Google, and TikTok each claim against that revenue to measure their over-counting, then isolate what your ads actually caused with a holdout test. What comes out is a single defensible number, and a client who stops judging you on an illusion.
On the menu
- Why the number that flatters you is the exact number that drives clients away.
- The proof, signed by eBay and Facebook, that their own numbers are smoke.
- The 4 steps to a number no CFO can break.
- The over-counting formula your competitors will not show their clients.
- How to report a lower number and walk out of the call in a stronger position.
Your Star Witness Works for the Other Side
Picture a trial. Every month your agency walks into the room, and across from you, the client is waiting. To their right, their CFO holds a bank statement. They know one number, their own: what actually landed in the account. On your side, your only piece of evidence is Ads Manager showing a ROAS of 5.
The problem is not that your number is false. The problem is who says it. Meta testifies in favor of Meta. The jury knows it, so your most important witness has no credibility. The louder it swears your ads drove everything, the less anyone believes it.
A platform grading its own homework will always give itself a good grade. That is exactly why the grade is worthless in front of a client.
This doubt is not the intuition of an anxious agency. It has been measured. In 2019, a team of researchers led by Brett Gordon, working with Facebook itself, compared the usual attribution methods against real controlled experiments, across fifteen campaigns and hundreds of millions of users. Their conclusion fits in one line: in half the cases, the standard methods overstated the real effect of the ads by a factor of three. The number you show is not slightly optimistic. It can be three times too high.
And when the measurement disappears, the mirage shows in an instant. In early 2022, Apple simply asked iPhone users whether they agreed to be tracked. Many said no. Meta put a figure on the fallout itself, in front of its shareholders: roughly ten billion dollars in lost sales for the year. Ten billion in "attributed" revenue that evaporated because the click could no longer be followed. The sales had not moved. The tracking was what manufactured them.
The Four Tricks That Inflate Your ROAS
The over-counting is not a mystery. It comes from four habits the platforms have all adopted, because those habits favor them.
First, the attribution window. Meta claims a sale if the click happened within seven days, sometimes a mere view within a day. Google reaches back as far as thirty. Your client sees your ad on Monday, types the brand name into Google on Friday, and buys. Both platforms claim the same sale. One sale, two owners.
Next, last click takes everything. The sale goes to the last channel touched, almost always branded search or retargeting. You reward the salesperson holding the front door and forget the one who walked the customer across town. Your top-of-funnel work drops off the radar.
Then there is the view-through conversion. The platform credits a sale to someone who only saw the ad and never clicked. Handy for padding a report. Impossible to defend in front of a client who thinks for two seconds.
And the biggest of them all, branded search. Someone types your client's name into Google, your ad shows up at the top, they click, they buy. The platform bills you and signs the sale. Except that person was already coming to buy. It is the exact trap eBay fell into, at the scale of a billion dollars.
Add up these four biases and you get a number that sits systematically above reality. Not out of malice, by design. A platform's job is to sell you more ads, and a high ROAS is its best sales pitch.
The Protocol No CFO Can Break
Here is the part you came for. A four-step protocol to build, every month, a number your client cannot contest, because it rests on their own money and on an experiment, not on a platform's testimony. Budget half a day the first time, less after that.
1. Set the ground truth
Never start with Meta. Start with the one number the client believes on instinct: what actually hit the bank. Export the net revenue collected over the period from Stripe or Shopify, refunds removed. That is your denominator, your floor, your reference point for everything else.
Result: a number the client cannot argue with, because it is theirs.
2. Measure the over-counting
Add up what each platform claims as revenue over the same period. Then divide that sum by the ground truth from step 1. You get an over-counting ratio. It is the formula nobody, on the agency side, puts on the table.
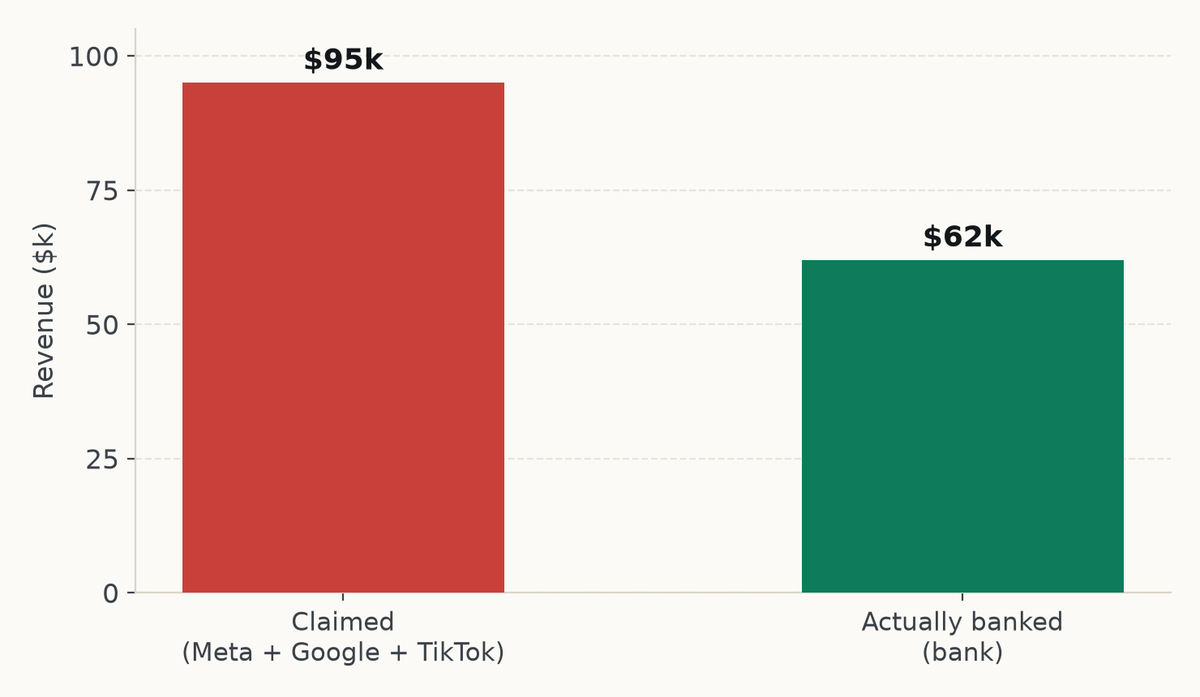
Overlap Ratio = (Meta revenue + Google revenue + TikTok revenue) / real revenue. A ratio around 1.15 is healthy. From 1.5 up, your platforms are stealing credit from each other. A channel's adjusted ROAS is then its platform ROAS divided by this ratio.
| Source | Claimed revenue |
|---|---|
| Meta | $40,000 |
| $35,000 | |
| TikTok | $20,000 |
| Total claimed | $95,000 |
| Real revenue (bank) | $62,000 |
| Overlap ratio | 95,000 / 62,000 = 1.53 |
A Meta ROAS shown at 4.0 becomes, once deflated, 4.0 / 1.53 ≈ 2.6. It is lower. It is above all defensible, because the client can redo the math with their own statement.
Result: the client sees with their own eyes that the inflation is not your fault, it is how the platforms work. You move from the defendant's bench to the expert's chair.
3. Isolate what you actually caused
The over-counting ratio fixes double counting. It does not yet prove causation. For that, you do what eBay did, in miniature: turn off the light to check it was lighting the room. Cut a channel, an audience, or a geographic zone for two to three weeks, and watch whether real revenue drops. What disappears when you cut is your true contribution. The rest would have happened without you.
The simplest version is a geo test: turn ads off in a few comparable regions, leave them on elsewhere, compare real sales. Two weeks are enough for a first signal.
Result: the one sentence that saves a budget in a meeting. "Here are the sales that disappear when we go dark. They would not exist without us."
4. The one-page report and the call script
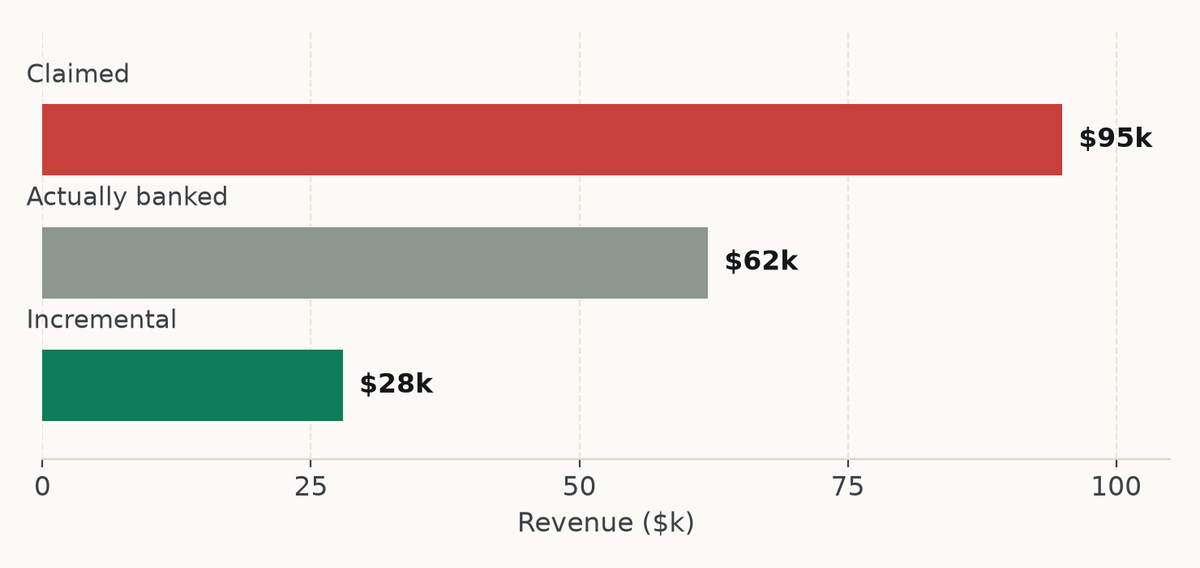
Do not drown the client in ten tabs. One page, three numbers, one conclusion. The claimed, the real, the incremental. Then the single number you defend.
| What you show | The number | What it says |
|---|---|---|
| Claimed by the platforms | $95,000 | "Here is what the platforms credit themselves." |
| Actually banked | $62,000 | "Here is the truth, yours." |
| Incremental (holdout test) | $28,000 | "Here is what would not exist without us." |
Result: you walk into the next call with proof, not excuses. The client stops comparing you to Meta's mirage and starts paying you for the incremental.
Reporting a Lower Number Without Losing the Client
You already see the problem. The honest number is smaller than the one that won you the account. Nobody enjoys walking into a meeting to halve their own ROAS. And yet that is exactly where retention is decided.
The reversal is simple. A lower but verifiable number beats a flattering one the client suspects. Trust is worth more than vanity. The day your client understands that you are the only person in the room giving them the truth, even when it is less pretty, you stop being a replaceable vendor. You become their safeguard.
You do not keep a client with the biggest number. You keep them with the one number they can defend without flinching.
Set the frame from the start, before the first report, on a single page: here is how we measure, here is why our number will be lower than the platforms', here is why that is good news for you. A client who was told the rules in advance does not panic when the number drops. They trust.
That trust has a measurable value. According to Nielsen's 2023 annual marketing report, barely more than half of marketers say they are confident in how they measure return on investment. In other words, your client doubts their own numbers as much as you doubt yours. The agency that finally hands them a certainty stops competing on price.
And for anyone who thinks client loyalty is dead: the forty oldest client-agency relationships in the world last an average of twenty-two years, according to the R3 consultancy. Loyalty is possible. It is not bought with an inflated ROAS. It is built on numbers that stand up.
Done by hand, this protocol costs several hours per client, every month. That is exactly what Metrikia automates: the platform reconciles your ad accounts with your bank revenue, computes the over-counting, measures the incremental, and generates daily and weekly PDF reports, downloadable and ready to send to the client. The proof becomes a deliverable, not a chore. Discover Metrikia.
If You Remember Only This
The platforms inflate your ROAS by design, and your client feels it. To prove your value, start from their real revenue, measure the over-counting, and isolate the incremental with a holdout. The number that comes out is lower, smaller, and the only one that keeps the client.
FAQ
Why doesn't my Meta ROAS match my Shopify revenue? Because Meta counts sales Shopify does not see as its own: view-through conversions, a 7-day window, sales already attributed to Google. Meta measures ad exposure, Shopify measures money banked. A 20 to 50% gap is common. A much larger gap points to a tracking problem.
How much gap between the platforms and the bank is normal? An over-counting ratio around 1.15 is healthy: the channels overlap a little, that is mechanical. From 1.5 up, your platforms are claiming the same sale in triple. It is not fraud, it is their design. Your job is to deflate that ratio, not to hide it from the client.
Should I show the client the platform ROAS or the real ROAS? Both, side by side, with the gap explained. Showing only the platform number sells a mirage that will blow up in your face. Showing only the real number without context reads as underperformance. The power is in the comparison: here is what we claim, here is the truth, here is our proven contribution.
What is an incrementality test, simply? It is turning off the light to check it was lighting the room. You cut ads in certain zones or for certain audiences, leave them on elsewhere, and compare real sales. The drop in the zones you cut is your true contribution. The rest would have happened without you. It is the only proof of cause and effect.
How do I report a lower number without losing the client? Set the frame before the first report: explain why your number will be lower than the platforms', and why that is good news. A forewarned client does not panic. They understand they are finally paying for the truth, not for an inflated score they would not dare show anyone.
Blended ROAS, MER, or platform ROAS: which one to report? Platform ROAS is for optimizing internally, never for proving. For the client, steer on real revenue divided by total spend, and keep the incremental as proof of value. One defensible number at the top of the report, the detail underneath for those who want to dig.
References
Blake, T., Nosko, C., & Tadelis, S. (2015). Consumer Heterogeneity and Paid Search Effectiveness: A Large-Scale Field Experiment. Econometrica, 83(1), 155-174. https://faculty.haas.berkeley.edu/stadelis/Tadelis.pdf
Gordon, B. R., Zettelmeyer, F., Bhargava, N., & Chapsky, D. (2019). A Comparison of Approaches to Advertising Measurement: Evidence from Big Field Experiments at Facebook. Marketing Science, 38(2), 193-225. https://www.kellogg.northwestern.edu/faculty/gordon_b/files/fb_comparison.pdf
Nielsen. (2023). 2023 Annual Marketing Report. https://www.nielsen.com/insights/2023/need-for-consistent-measurement-2023-nielsen-annual-marketing-report/
CNBC. (2022, February 2). Facebook says Apple iOS privacy change will cost $10 billion this year. https://www.cnbc.com/2022/02/02/facebook-says-apple-ios-privacy-change-will-cost-10-billion-this-year
R3 Worldwide. (2024). The top 40 client-agency relationships last an average of 22 years. https://rthree.com/insights/
Baptiste Noel, co-founder of Metrikia. MSc in Clinical Neuroscience and MSc in High Performance.