
Baptiste Noel
Growth and co-founder of Metrikia
- Master en neurosciences et neuropsychologies cliniques
- Master en entraînement et optimisation de la performance
- Créateur SaaS et de contenu, 20 000+ abonnés LinkedIn
Co-founder of Metrikia, Baptiste is building a SaaS from scratch and shares the growth journey unfiltered. A former clinical-neuroscience researcher and physical-performance coach, he built then left a coaching business generating over 70,000 EUR per month before focusing on product. He writes about growth strategy, acquisition and scaling.
LinkedInIncrementality Testing: How to Know Which Ads Actually Caused Your Sales
Incrementality testing is the only method that proves which ads caused your sales. Holdouts, geo-lift, and why platform lift tools grade themselves.
The only honest way to find out whether an ad is working is to turn it off.
Pause Meta in Michigan for two weeks while it keeps running everywhere else. If sales in Michigan drop, the ads were doing something real. If sales hold steady, you just learned that the conversions Meta was claiming would have happened anyway, and you have been paying for them.
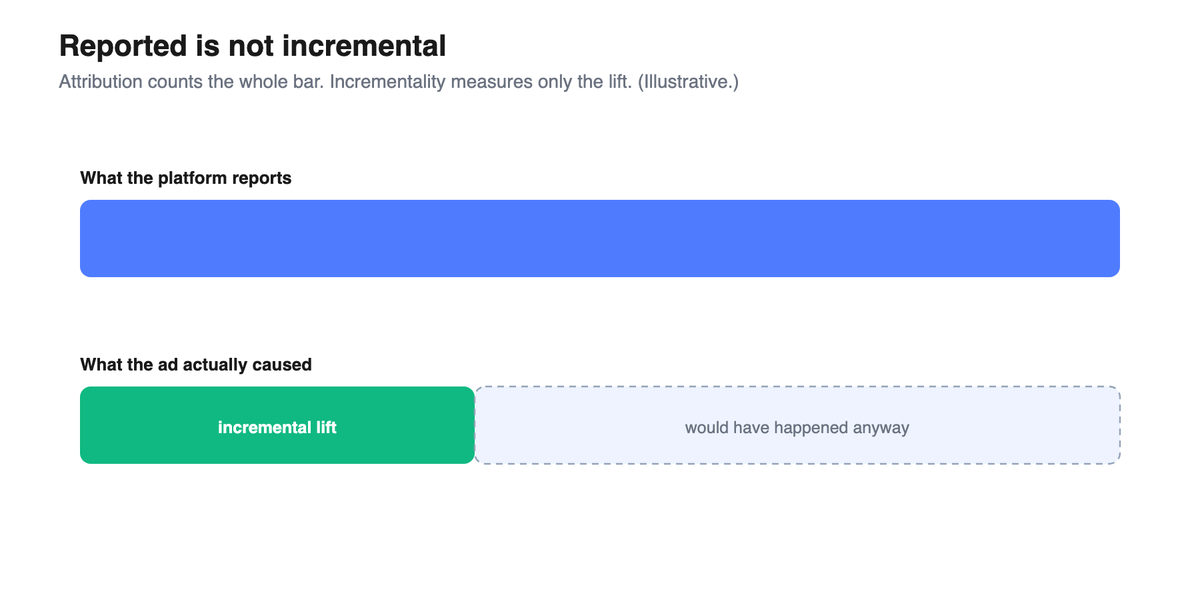
That uncomfortable little experiment has a name: incrementality testing. It is the only method in marketing that answers the question every other metric quietly dodges. Your dashboard tells you a sale was attributed to an ad. Incrementality tells you whether the ad caused it. Those are not the same question, and the gap between them is where most ad budgets quietly bleed.
Attribution tells you which ad to credit. Incrementality tells you which ad to keep. Only one of them survives you turning the campaign off.
On the menu:
- What incrementality actually measures, and why it is a causal question your dashboard cannot answer.
- The proof, from the ad platforms' own economists, that reported numbers overstate the truth.
- The three experiment designs: user holdouts, ghost ads, and geo-lift.
- Why platform-run lift tools grade their own homework, and what to do about it.
- How to run your first test without a data science team.
What incrementality testing actually measures
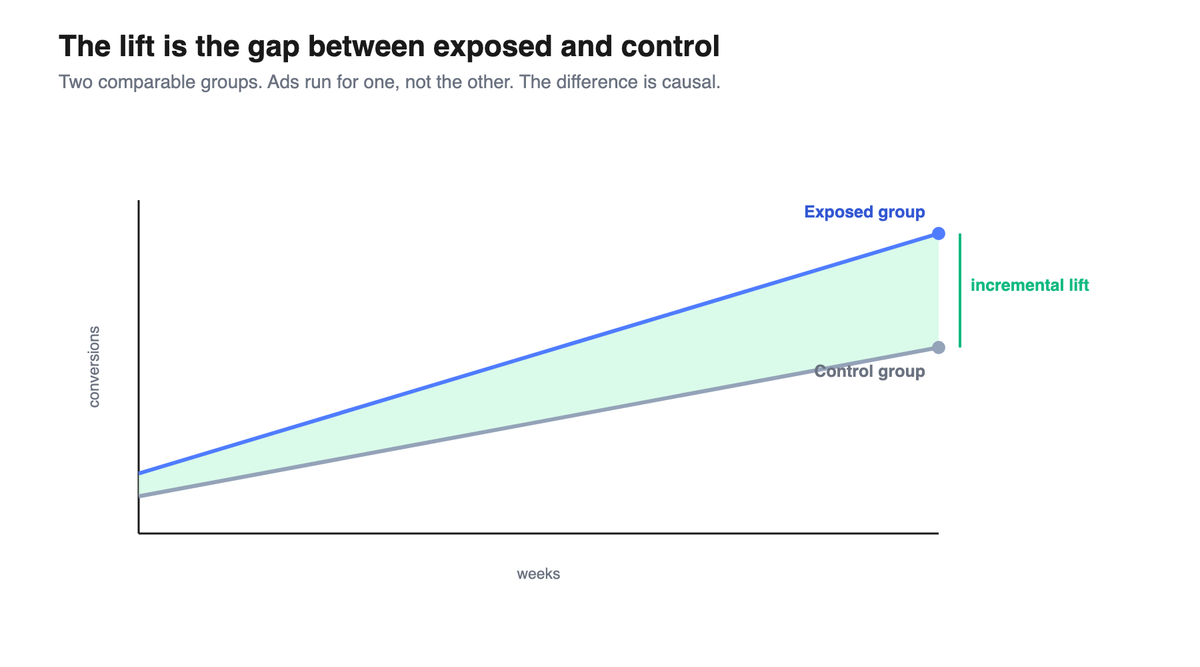
Incrementality testing measures the causal effect of advertising by comparing a group exposed to your ads against a comparable group that was deliberately kept unexposed, then reading the difference in outcomes between them. That difference, the lift, is the share of conversions your advertising actually created rather than merely witnessed.
The key idea is the counterfactual: what would have happened in the parallel world where you never ran the ad. You can never observe that world directly, so incrementality builds the closest empirical stand-in for it, a control group, and treats the gap between exposed and control as the ad's true contribution. In the language of causal inference, you are estimating an average treatment effect: take the conversion rate of the treated group, subtract the conversion rate of the control group, and what remains cannot be explained by season, by brand demand, or by buyers who were already on their way. It can only be explained by the ad.
Everything else in your stack, every pixel, every attribution model, every platform dashboard, is correlational. It records that a conversion happened near an ad. Incrementality is the one method that isolates cause from coincidence.
Why your dashboards cannot answer this
Hold a conversion in your hand and ask a simple question: would this person have bought without the ad? No attribution model can answer it, because attribution only ever works with conversions that already happened. It splits credit among the touchpoints it observed. It never compares against the world where the touchpoint was absent. We covered this trap in depth in our guide to the 9 attribution models: even the most advanced data-driven model is sophisticated correlation, not proof.
There is a specific, measured reason naive comparisons fail. Lewis, Rao, and Reiley (2011) named it activity bias: the moment someone is online and active enough to see your ad is also the moment they are doing more of everything, searching, signing up, buying. Ad exposure and conversion rise together not because the ad caused the sale, but because an active user does both at once. Compare exposed users to whoever happened not to see the ad and you mistake that shared activity for advertising effect. This is why an honest control group has to be built by deliberate randomization or geographic holdout, not found after the fact.
The evidence that this matters is not a vendor opinion. It is some of the most cited work in advertising economics, much of it produced by the platforms' own researchers. Gordon and colleagues (2019) ran fifteen large randomized experiments at Facebook, half a billion user-experiment observations, and showed that the observational and attribution methods marketers rely on routinely fail to recover the true causal effect the experiments revealed. Blake, Nosko, and Tadelis (2015) ran eBay's paid-search experiment and found returns a fraction of the non-experimental estimates, with brand-keyword ads producing almost no incremental sales because those buyers were arriving regardless. Lewis and Rao (2015) showed that even multimillion-dollar experiments leave advertising ROI statistically hard to pin down, which is precisely why a disciplined test design matters so much.
The three ways to build a control group
Every incrementality test is a variation on one move: create a group that does not see the ad, and compare. The designs differ in how they build that unexposed group, and which one you can use depends entirely on what data you are still allowed to collect.
User-level holdout (the randomized controlled trial)
Before the campaign launches, a random slice of your target audience is set aside and will never be shown the ad. Both groups are tracked the same way, and the difference in their conversion rates is the lift. This is the cleanest possible design, the textbook randomized controlled trial, and it is what platform tools like Meta Conversion Lift run under the hood, typically holding out something like five to ten percent of the audience. Its weakness is that it depends on the platform being able to identify and split individual users, which privacy changes have made far harder off-platform.
Ghost ads
Ghost ads, introduced by Johnson, Lewis, and Nubbemeyer (2017), solved an expensive problem. Older holdout tests showed the control group a placebo public-service announcement so you could measure who would have converted, which meant paying for useless impressions. Ghost ads instead log the ad that the system would have served to each control user without actually rendering it. You get a precise, randomized counterfactual without buying placebo inventory, and it works inside the real-time auction that optimizes ad delivery. It is the most elegant way to run a clean experiment on a live platform, and the work won a major academic award for exactly that reason.
Geo-lift (geo experiments)
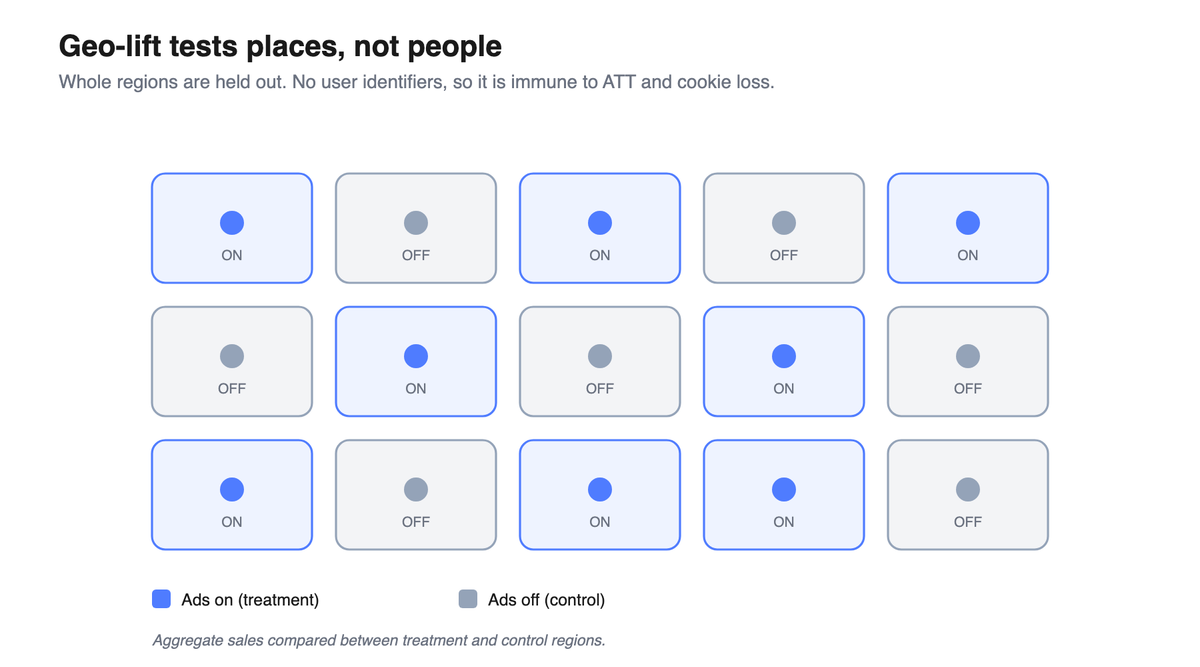
When you cannot track individuals, you stop testing people and start testing places. Geo experiments, formalized by Vaver and Koehler at Google (2011), split non-overlapping regions into treatment and control: you run ads in the treatment geographies, pause or withhold them in the control geographies, and compare aggregate sales between the two groups. Because it reads only region-level totals and never touches a user identifier, geo-lift is structurally immune to App Tracking Transparency and cookie loss. It compares groups, not people. That same property makes it the only method that can measure offline, retail, TV, and out-of-home advertising, none of which leave a clickable trail. When only a handful of regions are available, a time-based regression approach (Google's GeoX framework, Kerman, Wang, and Vaver, 2017) predicts the counterfactual sales curve for the held-out market and reads the lift as the gap between prediction and reality.
Here is how the three compare:
| Design | How the control is built | Needs user identifiers | Survives ATT and cookie loss | Best for |
|---|---|---|---|---|
| User-level holdout | Randomized users withheld | Yes | No | On-platform tests with logged-in users |
| Ghost ads | Logs the ad that would have served | Yes, at the ad-server level | Partially | Clean, low-cost platform RCTs |
| Geo-lift | Whole regions withheld | No (aggregate only) | Yes | Post-ATT, offline, TV, retail, out-of-home |
The trap: platforms grade their own homework
Meta Conversion Lift and Google Conversion Lift are real randomized experiments, and they are genuinely better than last-click. But notice who is running them. The company selling you the ads is also the company measuring whether the ads worked, scoring its own exam and reporting the grade. That is a structural conflict of interest, not an accusation of bad faith. A platform has every incentive to define the test, the audience, and the attribution window in ways that flatter its own inventory, and to claim conversions that other channels or plain organic demand would have produced anyway.
This is the same self-reporting problem that makes platform-reported ROAS diverge from your real ROAS, and it is why mature teams treat platform lift numbers as a useful input, never as the verdict. An independent geo-lift, designed and read outside the platform, against your own revenue, is the check on the platform's self-graded score. The methodology matters more than who provides the button, and the one party who should not own the final number is the party being measured.
How these models fit together: the verification layer
Step back and the whole measurement stack snaps into focus. Multi-touch attribution is the tactical lens, fast and granular but blind wherever tracking breaks. Marketing mix modeling is the strategic lens, immune to cookie loss because it reads only aggregate spend and sales, but too coarse for daily decisions. Incrementality is the causal lens, the only one that proves an effect, and the slowest to run. None of the three is trustworthy alone. They correct each other: attribution proposes where the credit goes, MMM keeps the portfolio honest, and incrementality settles which of them to believe.
This is the layer Metrikia is built to be. Server-side tracking and the Conversions API get the cleanest signal to the platforms, and you should run them. Then Metrikia sits on top as the verification layer: it reconciles what the platforms claim against the revenue that actually landed in your CRM, and it gives you the holdout and geo-lift structure to test causal questions instead of trusting self-reported credit. The platforms optimize toward their own scoreboard. Your job is to keep an independent one.
If you want to see the gap on your own numbers rather than on an example, book a demo: we plug in your platforms and your CRM and show you where reported conversions and real, incremental revenue part ways.
How to run your first incrementality test
You do not need a data science team to start. You need discipline about the control group.
- Pick one causal question. Not "is my marketing working" but "is my Meta prospecting incremental, or am I paying to reach people who already convert through search?" A test answers one question at a time.
- Choose the design your data allows. Logged-in users at scale, use a platform holdout but read it skeptically. Everyone else, especially post-ATT or with offline sales, run a geo-lift. It needs no user tracking.
- Build a real control. Split comparable regions into treatment and control, or hold out a random audience slice. The control must be genuinely withheld, not just "low spend." A leaky control silently kills the test.
- Run it long enough. Most geo tests run four to eight weeks, long enough to cover at least a couple of buying cycles. Short tests under-report the slower, consideration-stage lift and make good channels look dead.
- Read the lift against revenue, not the dashboard. Incremental ROAS is incremental revenue divided by the spend that produced it. If a channel's incremental ROAS is far below the ROAS the platform reports for it, you have just found budget to move.
The first time a holdout shows you that a channel you trusted carries far less lift than its dashboard claimed, the entire exercise pays for itself.
Conclusion
Every other number in marketing describes what happened next to your ads. Incrementality is the one that proves what happened because of them. It does this the only way causation can ever be established, by building a world without the ad and measuring the difference. That is slower and more disciplined than reading a dashboard, which is exactly why so few advertisers do it, and exactly why the ones who do stop overpaying for conversions that were always going to happen. Attribution tells you which ad to credit. Incrementality tells you which ad to keep.
FAQ
What is incrementality testing? Incrementality testing measures the causal effect of advertising by comparing an exposed group against a comparable unexposed control group. The difference in outcomes, the lift, is the share of conversions the advertising actually caused rather than merely co-occurred with.
What is the difference between incrementality and attribution? Attribution splits credit among the touchpoints it observed, which is correlational. Incrementality compares against a control group that never saw the ad, which is causal. Attribution tells you which ad to credit; incrementality tells you whether the ad caused the sale at all.
How do you measure incremental ROAS (iROAS)? Incremental ROAS is incremental revenue divided by the spend that produced it: take the revenue in the exposed group, subtract the revenue in the control group, and divide by the cost of the campaign. It is almost always lower than platform-reported ROAS, because the platform counts conversions that would have happened anyway.
What is a holdout test and how does it work? A holdout test deliberately withholds advertising from a randomly chosen group, users or whole regions, while running it everywhere else. The conversion gap between the exposed group and the held-out group is the incremental lift.
What is the difference between geo-lift and conversion lift? Conversion lift usually refers to a user-level holdout run inside a platform like Meta or Google. Geo-lift withholds advertising from entire geographic regions and compares aggregate sales. Geo-lift needs no user identifiers, so it survives ATT and cookie loss and can measure offline and TV.
What is a geo-lift test? A geo experiment randomly assigns non-overlapping regions to treatment and control, runs ads only in the treatment regions, and reads the difference in aggregate sales as the causal lift. It was formalized by Vaver and Koehler at Google in 2011.
What is Meta Conversion Lift? Meta Conversion Lift is a randomized controlled experiment run inside Meta that holds out a portion of the target audience and compares the conversion rate of exposed versus held-out users. It is more rigorous than last-click attribution, but it is run and reported by the platform selling the ads, so independent verification still matters.
How long should an incrementality test run? Most geo-lift tests run roughly four to eight weeks, long enough to span at least a couple of buying cycles. Tests shorter than a few weeks tend to under-report the slower, consideration-stage lift.
What is minimum detectable effect (MDE)? MDE is the smallest lift a test can reliably detect given how much data you have, how many treatment and control units, and how long the test runs. A smaller MDE requires more data or a longer window. It is the core input to planning whether a test is even worth running.
Why is incrementality better than last-click attribution? Last-click credits the final touchpoint, which is correlational and systematically overpays whatever sits closest to a purchase that was often already going to happen. Incrementality compares against a control group, so it measures what the advertising actually caused. They answer different questions, but only one survives you turning the campaign off.
Does geo-lift still work after iOS ATT and cookie loss? Yes, and that is its main advantage. Geo-lift reads only aggregate, region-level sales and never identifies an individual user, so privacy changes that broke pixel and user-level tracking do not degrade it.
Can small advertisers run incrementality tests? Yes, though smaller budgets make small lifts harder to detect. A simple, clean geo-lift on your single biggest channel is the right place to start, and it answers the one question that matters most: is this spend actually causing sales.
To see how this piece fits the whole, see our guide to building a complete tracking system, layer by layer.
References
Blake, T., Nosko, C., & Tadelis, S. (2015). Consumer heterogeneity and paid search effectiveness: A large-scale field experiment. Econometrica, 83(1), 155-174. https://doi.org/10.3982/ECTA12423
Gordon, B. R., Zettelmeyer, F., Bhargava, N., & Chapsky, D. (2019). A comparison of approaches to advertising measurement: Evidence from big field experiments at Facebook. Marketing Science, 38(2), 193-225. https://doi.org/10.1287/mksc.2018.1135
Johnson, G. A., Lewis, R. A., & Nubbemeyer, E. I. (2017). Ghost ads: Improving the economics of measuring online ad effectiveness. Journal of Marketing Research, 54(6), 867-884. https://doi.org/10.1509/jmr.15.0297
Kerman, J., Wang, P., & Vaver, J. (2017). Estimating ad effectiveness using geo experiments in a time-based regression framework. Google Inc. https://research.google/pubs/estimating-ad-effectiveness-using-geo-experiments-in-a-time-based-regression-framework/
Lewis, R. A., & Rao, J. M. (2015). The unfavorable economics of measuring the returns to advertising. The Quarterly Journal of Economics, 130(4), 1941-1973. https://doi.org/10.1093/qje/qjv023
Lewis, R. A., Rao, J. M., & Reiley, D. H. (2011). Here, there, and everywhere: Correlated online behaviors can lead to overestimates of the effects of advertising. Proceedings of the 20th International Conference on World Wide Web, 157-166. https://doi.org/10.1145/1963405.1963431
Vaver, J., & Koehler, J. (2011). Measuring ad effectiveness using geo experiments. Google Inc. https://research.google/pubs/measuring-ad-effectiveness-using-geo-experiments/
About the author
Baptiste Noel, co-founder of Metrikia. MSc in Clinical Neuroscience and MSc in High Performance.
Metrikia is the verification layer on top of your ad stack. Run server-side tracking to feed the algorithms clean signal, then let Metrikia reconcile what the platforms claim against your real revenue and stand up the holdout and geo tests that tell you what actually drove it, so you finally act on a number you can defend.