
Baptiste Noel
Growth and co-founder of Metrikia
- Master en neurosciences et neuropsychologies cliniques
- Master en entraînement et optimisation de la performance
- Créateur SaaS et de contenu, 20 000+ abonnés LinkedIn
Co-founder of Metrikia, Baptiste is building a SaaS from scratch and shares the growth journey unfiltered. A former clinical-neuroscience researcher and physical-performance coach, he built then left a coaching business generating over 70,000 EUR per month before focusing on product. He writes about growth strategy, acquisition and scaling.
LinkedInMulti-touch attribution: the 9 models that reveal which ads actually drive your sales
The 9 multi-touch attribution models, from first touch to Shapley, plus the limit nobody prints: none of them measures causation. What to pair them with.
Add up the conversions Meta, Google, and TikTok each reported for last month. Then compare that total to the number of sales that actually landed in your bank account. The platforms will claim two to three times more conversions than you really made.
They are not exactly lying. They are each counting the same sale. A buyer watches your TikTok ad, clicks your Google Search result the next day, then converts through a Meta retargeting ad three days after that, and all three platforms raise a hand and say "that one was mine." Every attribution model ever built exists to settle that argument: to decide which touchpoint, or which blend of them, actually earned the sale.
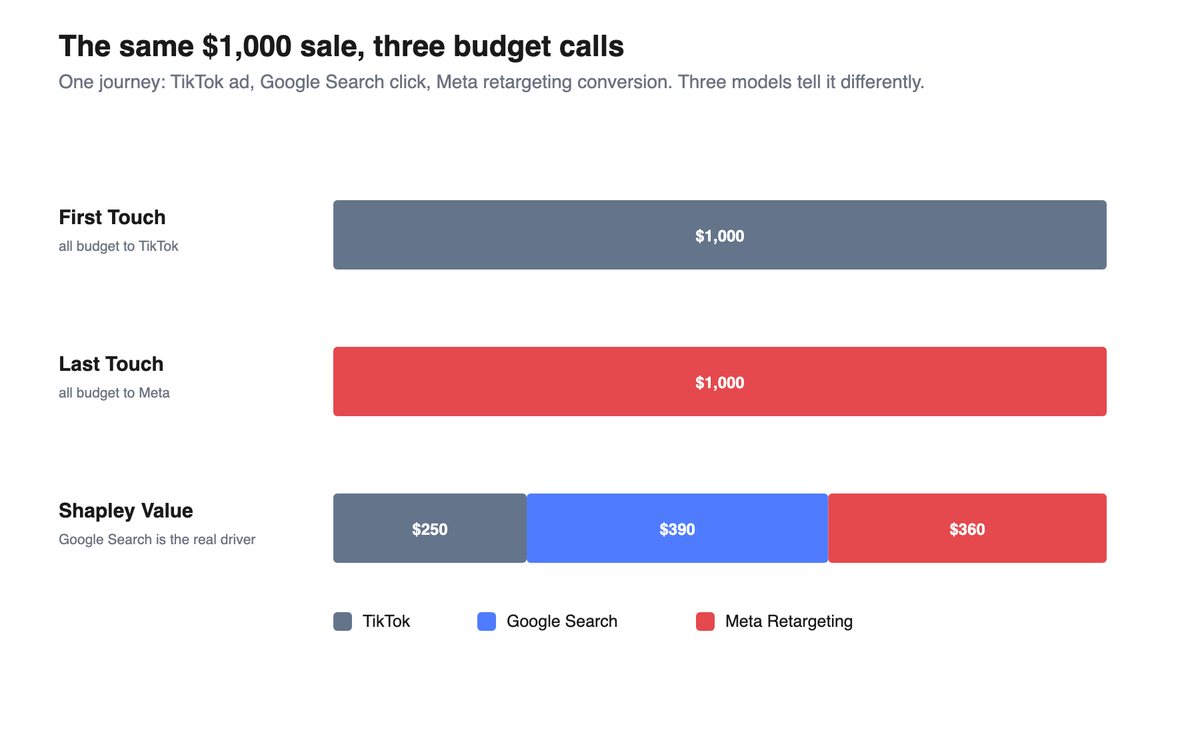
Here is the part the dashboards never tell you. Picking a model does not uncover the truth. It picks which story you would like to believe. First Touch hands the entire sale to TikTok. Last Touch hands it to Meta. Same journey, same thousand dollars, two models that point your budget in opposite directions. And even the most sophisticated model on the market, the one inside Google, is still only refereeing a fight over credit. None of them can call the single witness who actually knows the answer: what would have happened if you had never run the ad at all.
This is the honest guide to the nine attribution models. You will see how each one splits the credit, where each one quietly misleads you, the exact line where description stops and proof would have to begin, and how the best teams stop trusting any single number.
On the menu:
- The nine models, what each is good for, and the blind spot each one hides.
- Why one identical sale produces nine different budget calls.
- The trap almost nobody names: why even data-driven attribution is not causal.
- What attribution structurally cannot see, no matter how clean your tracking is.
- The three-lens framework (MTA, MMM, incrementality) that finally produces a number you can trust.
What an attribution model actually is
An attribution model is a rule for splitting the credit for one conversion across the multiple touchpoints that preceded it. Nothing more. It takes a customer journey the platform managed to record, and it decides how to divide one sale among the ads, clicks, and visits along the way.
There are two families. Rule-based models apply a fixed, human-chosen formula (give 100% to the last click, or split it evenly, or weight the first and last). Data-driven models learn the weights from your own conversion data instead of imposing them. Six of the models below are rule-based, three are data-driven. Knowing which family you are in matters more than knowing any single model, because it tells you where the bias comes from: a rule-based model is biased by the rule you picked, a data-driven model is biased by the data it was fed.
The 6 rule-based models
Rule-based models are fast, transparent, and require no historical data. You can switch one on today. The cost of that simplicity is that the formula is a guess about how influence works, applied identically to every journey.
1. First Touch. The discoverer
100% of the credit goes to the first touchpoint. The channel that introduced your brand to the prospect takes everything.
Use it when: you want to know which channels fill the top of the funnel. Useful for evaluating awareness campaigns in isolation.
Blind spot: it ignores everything between discovery and purchase, including the channel that actually closed the sale.
2. Last Touch. The closer
100% of the credit goes to the last touchpoint before conversion. The channel that triggered the purchase wins it all. This is still the default in most ad platforms, which is exactly why retargeting and branded search look so good in native dashboards.
Use it when: you optimize for immediate conversion and run mostly short journeys.
Blind spot: it erases all the acquisition and nurturing work that made the final click possible. It systematically overpays bottom-of-funnel channels.
3. Linear. The equalizer
Credit is split equally across every touchpoint. Three touchpoints means 33.3% each.
Use it when: you want an unbiased overview and have no strong conviction yet about your funnel.
Blind spot: it treats a decisive touchpoint and a throwaway one exactly the same. Equality is not accuracy.
4. Time Decay. Recency first
Touchpoints closer to the conversion get more credit. A click the day before purchase weighs more than an impression three weeks earlier.
Use it when: you run long sales cycles (B2B, real estate, high-ticket programs) where recent interactions genuinely carry more decision weight.
Blind spot: it structurally underrates the top of the funnel, so it quietly punishes the awareness channels that started the journey.
5. U-Shaped (Position-based). The strategist
40% to the first touchpoint, 40% to the last, 20% spread across the middle. It rewards discovery and conversion without fully ignoring the path in between.
Use it when: you have a classic funnel with a distinct awareness phase and a clear conversion moment. The most popular rule-based model among experienced media buyers.
Blind spot: the 40/20/40 split is still an assumption. If your real funnel does its heavy lifting in the middle, this model misses it.
6. W-Shaped. The precise one
30% to first contact, 30% to lead creation, 30% to last contact, 10% across the rest. Three key moments are singled out.
Use it when: you have a structured process with an identifiable lead-qualification step (form submission, discovery call). Common in B2B and agencies.
Blind spot: it only works if those three moments are cleanly tracked. Miss the lead-creation event and the model collapses back toward a noisy U-shape.
The 3 data-driven models
Data-driven models drop the fixed formula and learn the weights from your actual journeys. This is a real step up in sophistication, and it is where most people quietly assume they have crossed from correlation into truth. They have not, and the section after this explains why. But within the limits of observed data, these are the most honest splits you can get.
7. Full Path. The 4 key moments
Full Path identifies and weights four decisive moments in the customer journey: first interaction, lead creation, opportunity creation, and closing. The distribution adapts dynamically to your funnel instead of being hard-coded.
Use it when: you have a structured CRM with clear pipeline stages. The most relevant model for sales teams that track the full journey from lead to closed deal.
8. Markov Chain. Transition probabilities
The Markov Chain model treats the customer journey as a sequence of probabilistic transitions between channels and computes the removal effect: if I take Google Search out of the journeys entirely, how much does my total conversion probability drop? That drop is the channel's credit.
How it works:
- It builds a transition matrix across all your channels.
- It computes the conversion probability of the system with and without each channel.
- It assigns credit in proportion to how much removing the channel hurts.
Use it when: you have meaningful conversion volume (100+ per month) and want to understand each channel's contribution inside the whole ecosystem rather than in isolation.
9. Shapley Value. Game theory
The Shapley Value comes from cooperative game theory (Lloyd Shapley, 1953; Shapley was later a 2012 Nobel laureate in economics). It calculates each channel's marginal contribution by averaging how much that channel adds across every possible coalition of channels. It is the same logic behind Google's own data-driven attribution, which combines a counterfactual analysis with Shapley-value credit distribution.
How it works:
- It evaluates every possible combination of channels.
- It computes each channel's average marginal contribution across those combinations.
- For more than ~10 channels, exact computation becomes infeasible, so it uses Monte Carlo simulation and returns a score with a confidence interval.
Use it when: you want the most mathematically rigorous credit split available, especially before a large budget reallocation.
One journey, 9 different distributions
Here is the whole problem in one table. A lead sees a TikTok ad, clicks Google Search, then converts via Meta retargeting. The deal is worth $1,000. Watch the same sale get told nine different ways.
| Model | TikTok | Google Search | Meta Retargeting |
|---|---|---|---|
| First Touch | $1,000 | $0 | $0 |
| Last Touch | $0 | $0 | $1,000 |
| Linear | $333 | $334 | $333 |
| Time Decay | $150 | $300 | $550 |
| U-Shaped | $400 | $200 | $400 |
| W-Shaped | $300 | $400 | $300 |
| Full Path | $280 | $350 | $370 |
| Markov Chain | $220 | $420 | $360 |
| Shapley Value | $250 | $390 | $360 |
With First Touch you pour the budget into TikTok. With Last Touch everything goes to Meta. With Shapley you discover that Google Search is the real engine: it is the channel whose removal would cost you the most conversions. Three models, three completely different budget calls, from one identical sale.
Rule-based vs data-driven: when to use what
| Criteria | Rule-based (1-6) | Data-driven (7-9) |
|---|---|---|
| Minimum volume | None | 100+ conversions/month |
| Setup | Immediate | Requires historical data |
| Human bias | Yes (you pick the rule) | Lower (learned from data) |
| Accuracy within tracked data | Good | Superior |
| Interpretability | Intuitive | Requires analysis |
| Measures causation | No | No |
That last row is the one nobody prints, so it gets its own section.
The trap: data-driven attribution still is not causal
Here is the uncomfortable mechanism. Every model on this page, rule-based and data-driven alike, works on the conversions you already recorded. It answers one question: given the journeys we observed, how should we split the credit? It never answers the question you actually care about: would this sale have happened anyway, without the ad?
That second question is incrementality, and it is a causal question. Attribution is correlational by construction. Shapley and Markov are more sophisticated correlation, not a different category. A data-driven model can tell you that branded search touches 80% of your conversions and confidently hand it most of the credit, while the truth is that those buyers were going to type your name in regardless. The model sees the touchpoint. It cannot call the witness from the top of this article: the version of events where the ad never ran.
This is not a hot take. It is one of the most replicated findings in advertising measurement. Lewis and Rao (2015) ran 25 large advertising field experiments and found individual sales so volatile that even multimillion-dollar tests left the return on ad spend statistically unknowable, with confidence intervals more than 100 percentage points wide. Gordon and colleagues (2019) compared 15 randomized experiments at Facebook against the observational attribution methods marketers actually use, and found those methods routinely over- or misstated the true lift. Blake, Nosko, and Tadelis (2015) ran eBay's now-famous paid-search experiment and found that brand-keyword ads produced almost no incremental sales, because those buyers were going to arrive anyway. The pattern is consistent: the channels that look best in any attribution model are often the ones sitting closest to a purchase that was already going to happen.
So the right way to read all nine models is this. They are excellent at describing the journeys you tracked and allocating tactical credit between them. They are silent on whether the spend created the sale. Treat the output as a hypothesis about contribution, not a verdict on causation.
What multi-touch attribution structurally cannot see
Even the description job has hard limits, because the model can only weigh touchpoints it recorded. Everything below is a journey the math never sees.
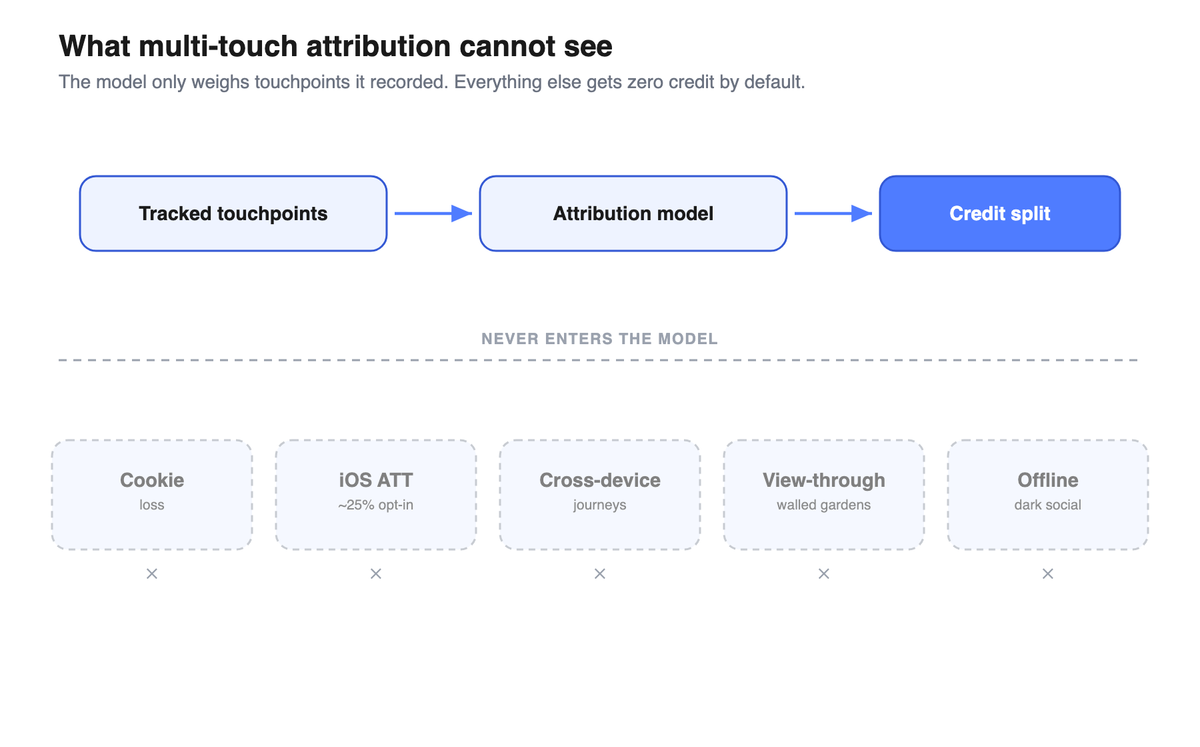
- Cookie loss and tracking prevention. Safari and Firefox block third-party cookies by default, Safari's Intelligent Tracking Prevention caps how long client-side cookies survive, and ad blockers strip tracking outright. (Chrome reversed its own cookie phase-out in April 2025 and still allows them, but the rest of the ecosystem already moved on.) Journeys break into fragments the model reads as separate users.
- iOS App Tracking Transparency. Since iOS 14.5 in April 2021, cross-app tracking requires explicit opt-in, and only roughly a quarter of users agree (Flurry). Deterministic, user-level stitching across apps broke for most mobile traffic.
- Cross-device journeys. A prospect discovers you on a phone during a commute and buys on a laptop that evening. Without a logged-in identity tying the two, attribution sees two strangers, not one journey.
- View-through and walled gardens. Impressions that influenced a buyer but were never clicked are mostly invisible, and each ad platform reports its own conversions using its own rules. Meta, Google, and TikTok will each happily claim the same sale.
- Offline and dark social. A WhatsApp recommendation, a podcast mention, a sales call: real causes of conversion that leave no trackable touchpoint and therefore receive zero credit by default.
This is why feeding clean server-side data back into the system matters. Recovering lost events through the Conversions API and deduplicating conversions across platforms gives any attribution model more of the journey to work with. It does not, however, make the model causal. It makes a correlational model less blind.
The three lenses: MTA, MMM, and incrementality
Mature measurement does not pick one method. It triangulates three, because each one repairs the others' biggest weakness.
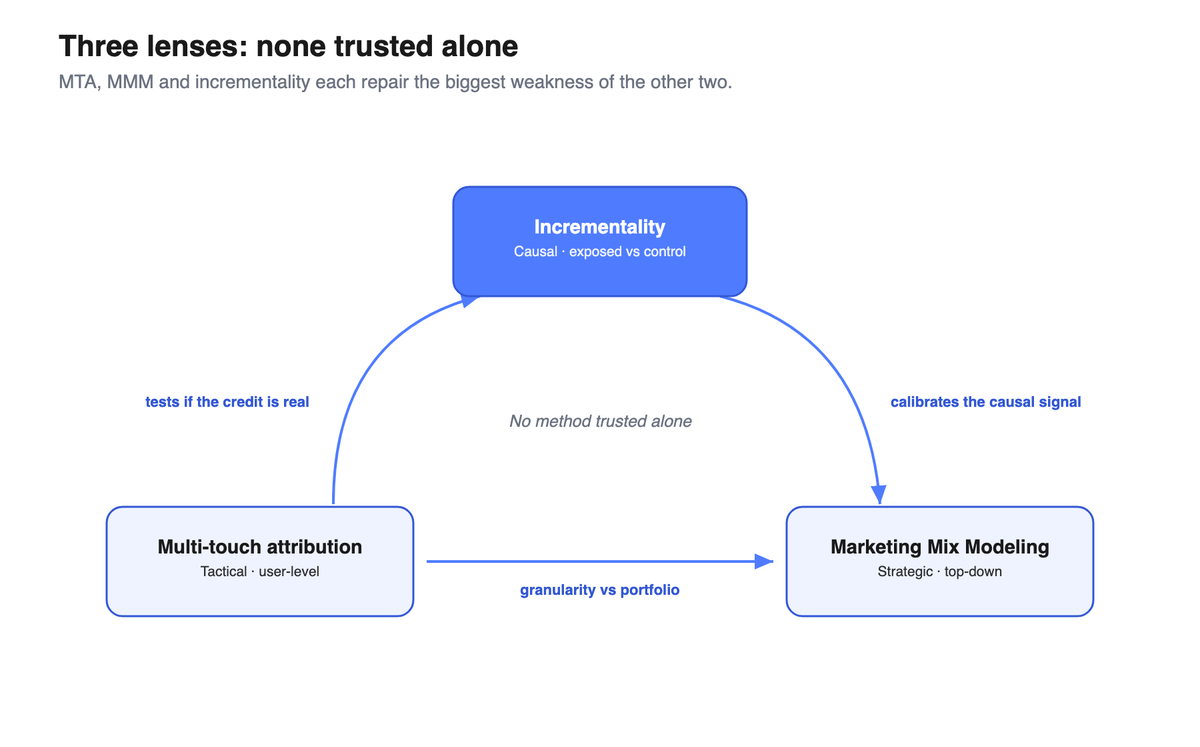
- Multi-touch attribution (MTA) is the tactical, user-level lens. It is granular and fast, ideal for in-flight optimization, but it is correlational and it goes blind wherever tracking breaks.
- [Marketing Mix Modeling (MMM)](/blog/what-is-marketing-mix-modeling) is the strategic, top-down lens. It works on aggregate spend and outcomes, so it needs no user-level tracking and survives cookie loss, but it is coarse and cannot tell you which creative won on Tuesday.
- Incrementality testing (geo holdouts, randomized conversion-lift experiments) is the causal lens. It is the only one of the three that answers "did the ad cause the sale" by comparing exposed and unexposed groups. It is the slowest and most disruptive to run, but it is the tiebreaker that tells you which of the other two lenses to believe.
Used together, the loop is self-correcting: MTA proposes where the credit goes, incrementality tests whether that credit is real, and MMM keeps the whole budget honest at the portfolio level. This is exactly the gap traditional ad-tracking tools leave open: they deliver the attribution number and stop, with no verification layer on top.
This is where Metrikia fits. It runs all nine attribution models on the same data at once, so you are never trapped in a single model's bias, and it reconciles those models against your real CRM revenue rather than against the platform's self-reported conversions. The attribution models give you the hypothesis. Reconciliation against closed revenue, and eventually a holdout test, tells you whether the hypothesis survives contact with reality.
How to use attribution without fooling yourself
A workable sequence:
- Start with U-Shaped for an immediately balanced, intuitive view while you have low volume.
- Graduate to a data-driven model (Shapley or Markov) once you pass roughly 100 conversions a month, and compare it against your rule-based view. The gap between them is the first map of where your budget is misallocated.
- Reconcile against CRM revenue, not platform-reported conversions. If a model loves a channel that your real ROAS says is mediocre, trust the cash.
- Validate big reallocations with a holdout before you move serious money. If Shapley says TikTok carries 5% of marginal contribution while it eats 30% of spend, pause TikTok in one region for two weeks and watch whether total conversions actually fall. That is the difference between a model's opinion and a measured fact.
Which attribution model should you use
If you need one answer: there is no single correct model, and choosing one in advance is the mistake. Run a rule-based model for intuition and a data-driven model for rigor, read them side by side, and let the disagreement between them flag where to investigate. Then verify the channels you are about to defund with an actual experiment. The model narrows the search. The experiment settles it.
Conclusion
Every attribution model redistributes credit among the touchpoints it can see. None of them proves the ad caused the sale, because that is a causal question and attribution is a correlational tool. The nine models on this page are genuinely useful: they turn a tangle of touchpoints into a tactical hypothesis about contribution, and the disagreement between them is itself a signal. But the moment you treat the prettiest number as the truth, you start reallocating budget toward whatever sits closest to conversions that were already going to happen. Use the models to form the hypothesis. Use reconciliation against real revenue, and incrementality testing, to find out if it is true.
FAQ
What is multi-touch attribution? Multi-touch attribution distributes the credit for a conversion across every touchpoint in a customer's journey, instead of giving 100% to a single click. It can use fixed rules (linear, time-decay, position-based) or data-driven algorithms (Markov, Shapley).
Which attribution model is best? There is no single best model. Within tracked data, data-driven models (Shapley, Markov) are the most accurate because they learn weights from your journeys instead of assuming them. But no attribution model measures causation, so the most reliable picture combines a data-driven model with an incrementality test.
What is the difference between first-click and last-click attribution? First-click gives 100% of the credit to the touchpoint that introduced the customer to your brand. Last-click gives 100% to the final touchpoint before the sale. They answer opposite questions, and they will point your budget in opposite directions on the same journey.
Is last-click attribution still used in Google Ads? Yes. When Google removed the cross-touch rule-based models in 2023, last-click remained available as a manual option, while data-driven attribution became the default.
What is data-driven attribution in GA4 and how does it work? It learns the credit weights from your own conversion paths rather than applying a fixed rule. Google combines a counterfactual analysis (comparing similar journeys with and without a touchpoint) with Shapley-value credit distribution. It needs meaningful data volume to run reliably.
What attribution models did Google remove from GA4 and Google Ads? First-click, linear, time-decay, and position-based. Google announced the change in April 2023 and fully retired those models by October 2023, keeping data-driven attribution as the default and last-click as a manual option.
What is the difference between deterministic and probabilistic attribution? Deterministic attribution links touchpoints through verified identifiers (a login, a device ID), which is accurate but collapses when those IDs disappear after ATT and cookie loss. Probabilistic attribution infers the match statistically from signals like device and IP, which covers more journeys but introduces misattribution.
What is view-through vs click-through attribution? Click-through credits a user who actively clicked an ad and then converted. View-through credits an impression that was merely seen, not clicked, before a conversion inside a window. View-through inflates how much credit a platform claims for itself.
What is the difference between attribution and incrementality? Attribution splits credit among the touchpoints it observed (correlation). Incrementality measures whether the ad actually caused conversions that would not have happened otherwise (causation), by comparing an exposed group against a randomized control or a held-out geography.
What is a walled garden in advertising? A walled garden is an ad platform (Google, Meta, Amazon, TikTok) that runs its own attribution model on its own inventory and reports its own conversions. Because each one claims credit independently, summing platform-reported conversions routinely overshoots your real total by two to three times.
How did iOS 14.5 (ATT) affect ad attribution? Since April 2021, apps must ask permission before tracking users across other apps, and only about a quarter agree. That broke deterministic, user-level tracking for most mobile traffic and pushed platforms toward modeled, probabilistic conversions.
Are third-party cookies going away in Chrome? No, not anymore. After years of announced phase-outs, Google decided in April 2025 to keep third-party cookies in Chrome. They remain blocked by default in Safari and Firefox, so attribution still degrades, just not because of Chrome.
References
Anderl, E. M., Becker, I., von Wangenheim, F., & Schumann, J. H. (2016). Mapping the customer journey: Lessons learned from graph-based online attribution modeling. International Journal of Research in Marketing, 33(3), 457-474. https://doi.org/10.1016/j.ijresmar.2016.03.001
Apple. (2021). App Tracking Transparency [Developer documentation]. https://developer.apple.com/documentation/apptrackingtransparency
Blake, T., Nosko, C., & Tadelis, S. (2015). Consumer heterogeneity and paid search effectiveness: A large-scale field experiment. Econometrica, 83(1), 155-174. https://doi.org/10.3982/ECTA12423
Flurry Analytics. (2021). iOS 14.5 opt-in rate: App Tracking Transparency updates. https://www.flurry.com/blog/att-opt-in-rate-monthly-updates/
Google Ads Developer Blog. (2023, April 20). First click, linear, time decay, and position-based attribution models are going away in Google Ads API. https://ads-developers.googleblog.com/2023/04/first-click-linear-time-decay-and.html
Google Privacy Sandbox. (2025, April 22). Next steps for Privacy Sandbox and tracking protections in Chrome. https://privacysandbox.google.com/blog/privacy-sandbox-next-steps
Gordon, B. R., Zettelmeyer, F., Bhargava, N., & Chapsky, D. (2019). A comparison of approaches to advertising measurement: Evidence from big field experiments at Facebook. Marketing Science, 38(2), 193-225. https://doi.org/10.1287/mksc.2018.1135
Lewis, R. A., & Rao, J. M. (2015). The unfavorable economics of measuring the returns to advertising. The Quarterly Journal of Economics, 130(4), 1941-1973. https://doi.org/10.1093/qje/qjv023
Shapley, L. S. (1953). A value for n-person games. In H. W. Kuhn & A. W. Tucker (Eds.), Contributions to the theory of games (Vol. 2, pp. 307-317). Princeton University Press.
About the author
About the author: Baptiste Noel, co-founder of Metrikia. MSc in Clinical Neuroscience and MSc in High Performance.