
Baptiste Noel
Growth and co-founder of Metrikia
- Master en neurosciences et neuropsychologies cliniques
- Master en entraînement et optimisation de la performance
- Créateur SaaS et de contenu, 20 000+ abonnés LinkedIn
Co-founder of Metrikia, Baptiste is building a SaaS from scratch and shares the growth journey unfiltered. A former clinical-neuroscience researcher and physical-performance coach, he built then left a coaching business generating over 70,000 EUR per month before focusing on product. He writes about growth strategy, acquisition and scaling.
LinkedInYour AI-Built Meta Ads Dashboard Is Lying With a Straight Face
Building a Meta Ads dashboard with an AI in 20 minutes automates the platform's number, not the truth. Why it is ungrounded, and how to fix it.
It takes about twenty minutes now. You connect Claude to your Meta ad account through an MCP server, you ask it to build you a reporting dashboard, and out comes something genuinely beautiful: clean charts, a confident narrator that explains why ROAS dipped on Tuesday, a blended return of 4.2 that recalculates itself every morning. It feels like the future of analytics arrived on your laptop over a weekend.
There is only one problem, and it is not a small one. The number was never real. And now it updates itself automatically, wrapped in an interface so polished that doubting it feels like doubting a calculator.
This is not an argument against building with AI. I ship with Claude Code every day, and an LLM wired to an API is one of the highest-leverage tools a marketer has had in a decade. It is an argument about where you point it. There is exactly one place in your stack where you do not let a model autocomplete the answer: the number your budget decisions depend on. Connect an agent to the Meta Marketing API and ask it to "build me a dashboard," and you have not measured your advertising. You have automated the platform's sales pitch, given it a chart library, and removed the last bit of friction that might have made you question it.
Here is what is on the menu. First, what actually happens, mechanically, when you pipe the Meta API into an LLM. Then why the number it returns was poisoned before the agent ever touched it. Then the part almost nobody talks about: the two well-documented cognitive biases that make an AI-generated dashboard more dangerous than the messy spreadsheet it replaced. And finally, how to do this right, because the answer is not "stop using AI," it is "ground the data first, render it last."
What you actually built when you connected Claude to Meta
The Model Context Protocol, which Anthropic introduced in November 2024, is a genuinely good idea. It is an open standard for letting an AI assistant reach the systems where your data lives, described, fairly, as a "USB-C port for AI." Community-built MCP servers that wrap the Meta Marketing API now exist, and they do exactly what you would hope: an agent can pull spend, impressions, clicks, and attributed conversions in plain language, then assemble them into whatever view you ask for.
Sit with the mechanism for a second, because the mechanism is the whole story. The agent is not auditing Meta. It cannot. It has no independent source of truth to audit against. It calls the Insights endpoint, receives a JSON payload of numbers, and faithfully renders those numbers into the dashboard you requested. The LLM is a perfect, obedient renderer of whatever it is fed. Its fluency, the thing that makes the output feel intelligent, is applied entirely to presentation, not to verification.
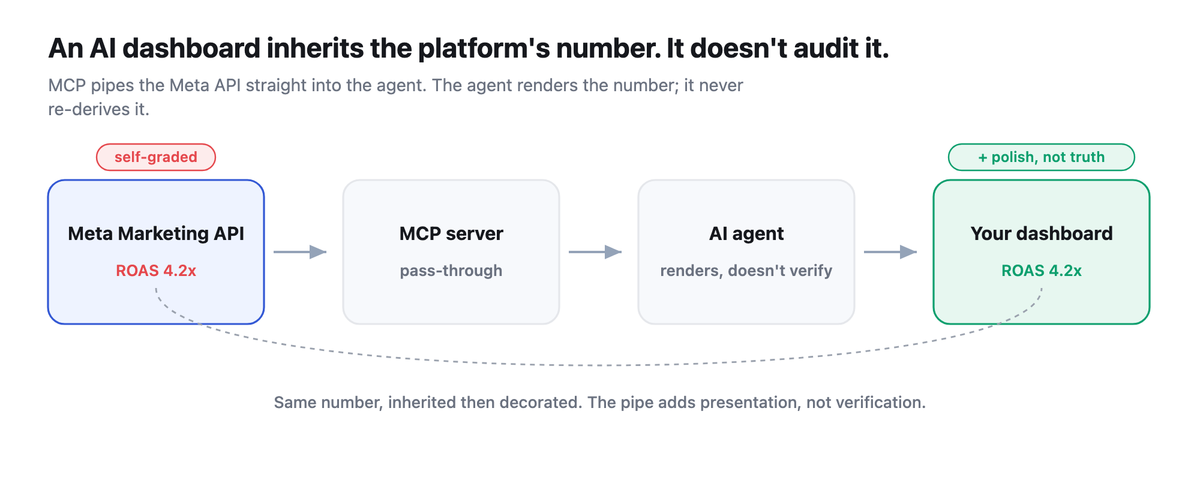
So the quality of your dashboard is capped, exactly, at the quality of the number coming out of the API. The agent cannot raise that ceiling. It can only make whatever is below it look more authoritative. Garbage in, garbage out is an old idea. What is new is garbage in, garbage out at scale, on a schedule, with a narrator who explains the garbage in a calm and competent voice.
The number the API hands back was never neutral
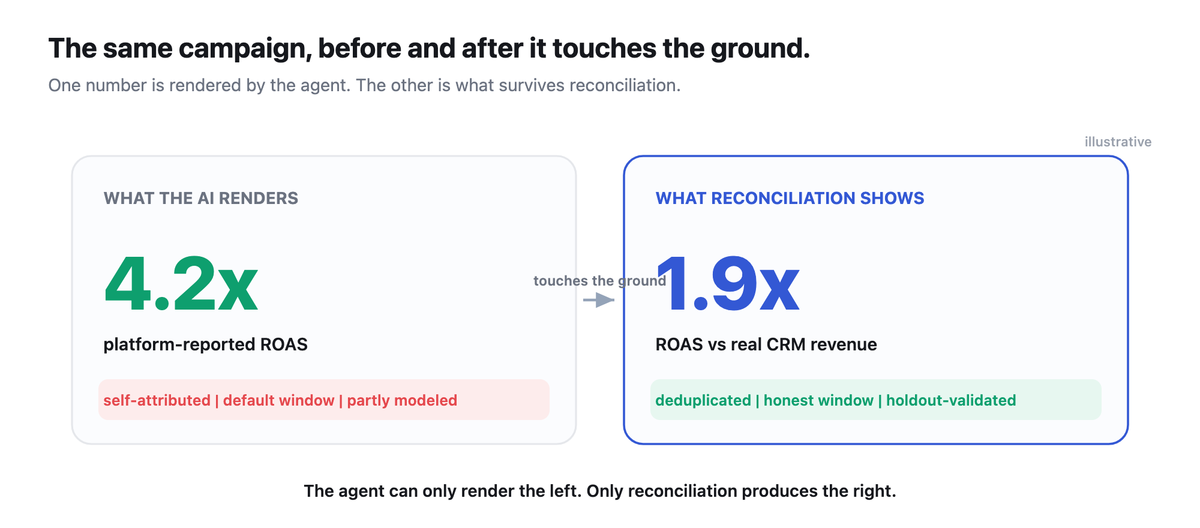
Now the uncomfortable part. The conversions the Meta Marketing API returns are not a neutral count of what happened. They are Meta's own count of the conversions Meta credits to Meta ads, generated by the same company that sells you the ads, using the attribution rules that company prefers. Three structural facts make this worse than it sounds.
First, the attribution window. If your API request does not specify action_attribution_windows, the Insights endpoint defaults to a 7-day click window (the platform's headline conversion number combines 7-day click with 1-day view). That single default decides which sales get credited to Meta. A purchase that happened six days after someone clicked an ad and then found you again through Google and a friend's text gets counted, in full, as a Meta conversion. Your agent does not know to question the window. It just reports the number the window produced.
Second, an increasing share of those conversions are modeled, not observed. Since the post-ATT collapse of deterministic tracking, platforms statistically estimate conversions they can no longer see one to one. Google documents this openly as "modeled conversions," and Meta applies the same logic through its post-ATT measurement stack. So part of the "data" your dashboard sits on is not data. It is the platform's machine estimate of what it thinks probably happened, presented to your agent as a hard integer.
Third, every platform does this to itself, in isolation, which is why the numbers do not add up across channels. A single buyer touched by Meta, Google, and TikTok inside their respective windows is counted once by each. No platform deduplicates against the others, because no platform can see the others. Sum the conversions your three platform dashboards claim, and the total will exceed the number of sales your bank actually saw. The arithmetic is not subtle, it is structural.
How wrong does this get? The best evidence we have is experimental. Gordon, Zettelmeyer, Bhargava, and Chapsky ran fifteen large randomized experiments at Facebook, 500 million user-experiment observations across 1.6 billion impressions, and compared the platform's observational logic against true randomized lift. For purchase outcomes, the observational estimate was off by roughly a factor of three. In one campaign, the naive exposed-versus-unexposed comparison showed a 316 percent lift where the real, randomized lift was 73 percent, more than four times too high. In another, the observational method reported a 1,306 percent lift against a true lift of 2.4 percent. And the error was not even reliably in one direction, which means you cannot correct for it with a mental discount. This is the number flowing through the pipe into your agent.
Lewis and Rao put the deeper problem cleanly: in twenty-five large advertising field experiments, individual sales were so volatile relative to ad spend that even experiments with millions of subjects left the confidence interval on ROI more than 100 percentage points wide. If a controlled experiment costing real money often cannot tell a great campaign from a money-loser, an observational dashboard, reading the platform's self-graded number, has no chance. That is the gap between reported ROAS and real ROAS, and the Conversions API does not close it. An AI front-end does not close it either. It paints over it.
Why the AI dashboard is worse than the spreadsheet it replaced
Here is the claim that matters, and it is counterintuitive: piping this number through an LLM does not just preserve the error. It makes you more likely to act on it. Two of the most replicated findings in the study of human judgment explain why.
The first is automation bias. Skitka, Mosier, and Burdick defined it precisely as the tendency to use automation as a heuristic replacement for vigilant information seeking and processing. In plain terms: when a machine hands us an answer, we stop looking. We defer. This is not a quirk of careless people. Goddard, Roudsari, and Wyatt confirmed in a systematic review that automation bias is real, measured, and recurring even among trained clinicians using decision-support systems, people in a high-stakes domain who had every reason to stay skeptical and deferred to wrong automated advice anyway. Parasuraman and Riley named this failure mode "misuse," over-reliance on automation, almost thirty years ago. A chat agent that produces a finished dashboard is automation bias delivered in its most seductive possible form.
The second is the illusion of explanatory depth. Rozenblit and Keil showed that people dramatically overestimate how well they understand how things work, and crucially, that the illusion is strongest for explanatory and causal knowledge, exactly the kind of knowledge an AI narrator simulates when it tells you "ROAS dropped because your retargeting audience saturated." Read that sentence and you feel like you understand the mechanism. You do not. Nobody audited whether retargeting saturation is what happened, or whether the underlying conversions are even real. The fluent causal story supplied the feeling of understanding without any of the substance.
Stack the two together and you get the trap. The illusion of explanatory depth manufactures the sense that you understand the number. Automation bias removes the impulse to check it. The dashboard is now beautiful, conversational, and self-updating, and every one of those properties lowers your guard at the exact moment the underlying number least deserves your trust. This is the aesthetic of rigor without the substance of rigor, and it is the most expensive kind, because it costs you the doubt that used to protect you.
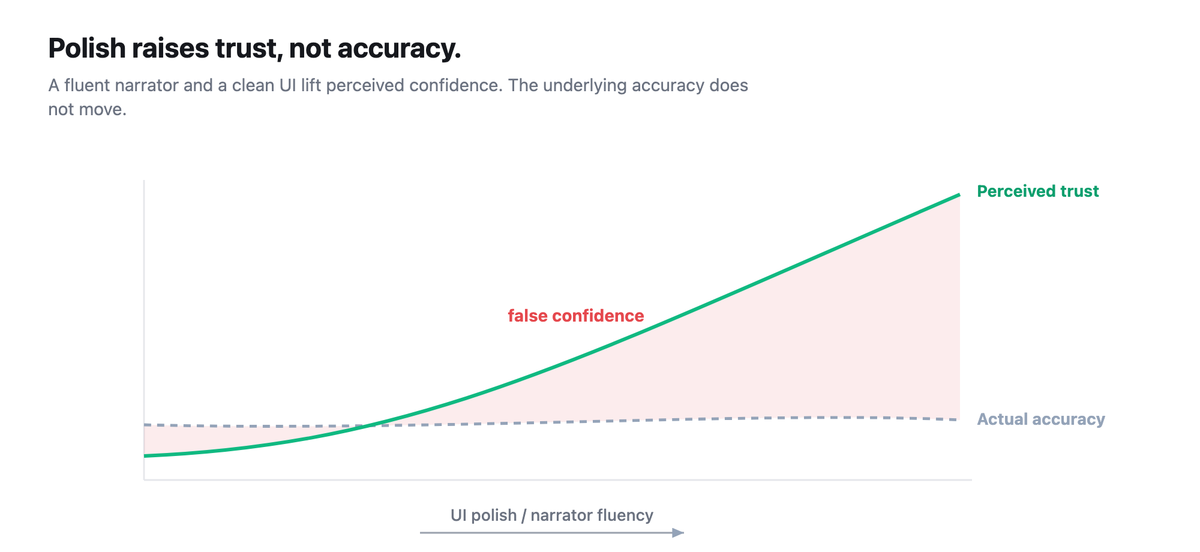
The old spreadsheet was ugly, and its ugliness was a feature. Pasting numbers in by hand, you saw the seams. You remembered that the Meta column and the Shopify column never quite reconciled. The friction kept a small, healthy voice of suspicion alive. The AI dashboard's entire value proposition is removing that friction, and the friction was load-bearing. An AI did not make your dashboard more accurate. It made your wrong number faster, prettier, and much harder to doubt.
There is a narrower, more technical failure on top of the cognitive one. LLMs still make confident arithmetic and aggregation mistakes. Recent benchmark work on real-world calculation found that among the errors models made, the large majority were calculation or precision and rounding errors, and separate benchmark work on table reasoning shows models degrade and misalign rows and columns when asked to reason over structured data. An agent writing a fresh query each session also produces numbers that do not reproduce: ask the same question on Monday and Thursday and the model may define the metric differently, choose a different window, or aggregate a different column, with no lineage and no audit trail to tell you which run was right. None of this is disqualifying for AI tooling in general. It is disqualifying for letting an agent silently own the definition of the number you steer spend by.
Ungrounded by design
The French have a useful phrase for this: hors sol, literally "off the ground," grown without roots in soil. It is the precise description of a dashboard whose numbers trace back to nothing outside the platform that produced them. Such a dashboard can be perfectly internally consistent, every chart agreeing with every other chart, every total footing, and still be entirely false, because internal consistency is not truth. A closed loop of self-attributed, default-windowed, partly-modeled numbers will always agree with itself. That is exactly what makes it dangerous.
A measurement is grounded when its numbers are tied to something the platform cannot grade for itself: the cash that actually landed in your bank, the orders that actually shipped, the deals your CRM actually closed, and ideally a holdout or geo-lift test that establishes what the advertising actually caused. None of those live inside the Meta API. So no agent reading only the Meta API, however capable the agent, can produce a grounded number. The ceiling is set by the source, and the source is ungrounded by design. This is the same structural reason the nine attribution models disagree with each other, and the reason Meta's reported ROAS is misleading no matter how you visualize it.
Build the front-end with AI. Just don't let it pick the number.
So the fix is not to put the toys away. The fix is to change what the agent reads from. A dashboard is only as honest as the layer underneath it, and the entire problem above comes from one design choice: pointing the agent straight at the platform's self-graded API. Point it at a measurement layer that has already reconciled the platform's claims against your real revenue, and the same MCP-powered, AI-rendered, self-updating dashboard becomes an asset instead of a liability. The rendering was never the hard part. The ground truth was.
This is the seam Metrikia is built to sit in. Metrikia takes the conversions the platforms claim and reconciles them against the revenue that actually landed in your CRM, deduplicates the same sale claimed by Meta, Google, and TikTok, holds the attribution window honest instead of accepting each platform's default, and gives you the holdout structure to test whether the spend caused the result rather than merely preceded it. It is the verification layer the platforms will never build, because their incentive is to keep grading their own homework. Build whatever front-end you like on top of it, with Claude, with an MCP server, with whatever ships next quarter. Just let it read a number that already touched the ground.
The platforms optimize toward their own scoreboard. Your job is to keep an independent one, and then, by all means, make it beautiful.
How to wire an AI dashboard to ground truth
If you are going to build this, the order of operations is the entire lesson. Ground first, render last.
- Reconcile to cash before you visualize anything. The anchor is the revenue that actually arrived: your CRM, your payment processor, your bank. Every platform number is a claim to be checked against that anchor, not a fact to be charted.
- Deduplicate across channels. Before you sum anything, resolve the same conversion claimed by multiple platforms down to one real event, or your blended total is inflated by construction.
- Set the attribution window deliberately, once. Do not let each API hand you its own default. Choose a window, apply it consistently across channels, and write down which one you chose, so Monday's number and Thursday's number mean the same thing.
- Validate the moves that cost real money with an experiment. Before you reallocate serious budget on the strength of a chart, confirm the causal claim with a holdout or geo-lift. A dashboard can rank channels. Only an experiment can tell you one of them caused the sale.
- Then, and only then, let the AI render it. Once the number underneath is reconciled, deduplicated, windowed, and where it matters causally validated, an LLM front-end is genuinely excellent at the last mile: summarizing, surfacing anomalies, answering follow-ups in plain language. That is the right job for the agent. Picking the number was never it.
The difference between a dangerous AI dashboard and a great one is not the model, the prompt, or the MCP server. It is whether the data had roots before the agent ever drew the first chart.
Frequently asked questions
Can I just tell Claude to be skeptical of the numbers? No, because skepticism has nothing to read. The agent has no independent source to check the Meta number against. Instructing it to "be critical" produces critical-sounding language, not a corrected number. Skepticism without a second source of truth is theater. The fix is to give it a reconciled source, not a better personality.
Isn't an MCP dashboard fine if I understand the data myself? It is better, but understanding the data does not change what the API returns. You still receive self-attributed, default-windowed, partly-modeled conversions, and you are still subject to automation bias and the illusion of explanatory depth, which the research shows operate on experts too. Understanding the limits is necessary. It is not sufficient. The number still needs to be grounded.
Is this only a Meta problem? No. The same logic applies to a Google Ads MCP, a TikTok MCP, or any other platform connector. Every platform returns its own self-attributed numbers on its own windows, and connecting an agent to several of them at once makes the cross-platform double-counting worse, not better, because now the inflated total is assembled automatically.
So I should never use AI for reporting? The opposite. AI is excellent for reporting, once the number is grounded. The argument is about sequence, not tools: reconcile, deduplicate, window, and validate first, then let the agent summarize and visualize. The danger is exclusively in letting the model own the definition of the number you steer spend by.
Why is an AI dashboard more dangerous than a manual one if the data is identical? Because of how you respond to it. The manual spreadsheet's friction kept your doubt alive. The AI dashboard removes that friction and adds a fluent narrator, which automation bias and the illusion of explanatory depth turn into false confidence. Same wrong number, far higher odds you act on it.
What does it cost to do this properly versus the DIY pipe? The DIY pipe is nearly free to build and expensive to trust, because the cost shows up later as misallocated budget you cannot see. A reconciliation layer has a real subscription cost and saves you from steering six and seven figures of spend by a number that was off by a factor of three or more. The honest framing is not cheap versus expensive. It is a visible cost now versus an invisible one compounding every month.
References
Anthropic. (2024, November 25). Introducing the Model Context Protocol. https://www.anthropic.com/news/model-context-protocol
Goddard, K., Roudsari, A., & Wyatt, J. C. (2012). Automation bias: A systematic review of frequency, effect mediators, and mitigators. Journal of the American Medical Informatics Association, 19(1), 121-127. https://doi.org/10.1136/amiajnl-2011-000089
Gordon, B. R., Zettelmeyer, F., Bhargava, N., & Chapsky, D. (2019). A comparison of approaches to advertising measurement: Evidence from big field experiments at Facebook. Marketing Science, 38(2), 193-225. https://doi.org/10.1287/mksc.2018.1135
Lewis, R. A., & Rao, J. M. (2015). The unfavorable economics of measuring the returns to advertising. The Quarterly Journal of Economics, 130(4), 1941-1973. https://doi.org/10.1093/qje/qjv023
Meta. Marketing API: Insights and action attribution windows. https://developers.facebook.com/docs/marketing-api/insights/
Parasuraman, R., & Riley, V. (1997). Humans and automation: Use, misuse, disuse, abuse. Human Factors, 39(2), 230-253. https://doi.org/10.1518/001872097778543886
Rozenblit, L., & Keil, F. (2002). The misunderstood limits of folk science: An illusion of explanatory depth. Cognitive Science, 26(5), 521-562. https://doi.org/10.1207/s15516709cog2605_1
Skitka, L. J., Mosier, K. L., & Burdick, M. (1999). Does automation bias decision-making? International Journal of Human-Computer Studies, 51(5), 991-1006. https://doi.org/10.1006/ijhc.1999.0252
About the author
Baptiste Noel, co-founder of Metrikia. MSc in Clinical Neuroscience and MSc in High Performance.
Metrikia is the verification layer on top of your ad stack. Connect whatever front-end you like, with an MCP server, with Claude, with whatever ships next, but point it at a number that has already been reconciled against your real revenue, deduplicated across channels, and where it matters validated by a holdout, so the dashboard you finally trust is one that touched the ground.