
Baptiste Noel
Growth and co-founder of Metrikia
- Master en neurosciences et neuropsychologies cliniques
- Master en entraînement et optimisation de la performance
- Créateur SaaS et de contenu, 20 000+ abonnés LinkedIn
Co-founder of Metrikia, Baptiste is building a SaaS from scratch and shares the growth journey unfiltered. A former clinical-neuroscience researcher and physical-performance coach, he built then left a coaching business generating over 70,000 EUR per month before focusing on product. He writes about growth strategy, acquisition and scaling.
LinkedInAd attribution tools compared (2026): the honest verdict of a marketer who has tried them all
Triple Whale, Hyros, Northbeam, Cometly, Wicked Reports and others, compared by a marketer who used them all. Capability matrix, no leaderboard.
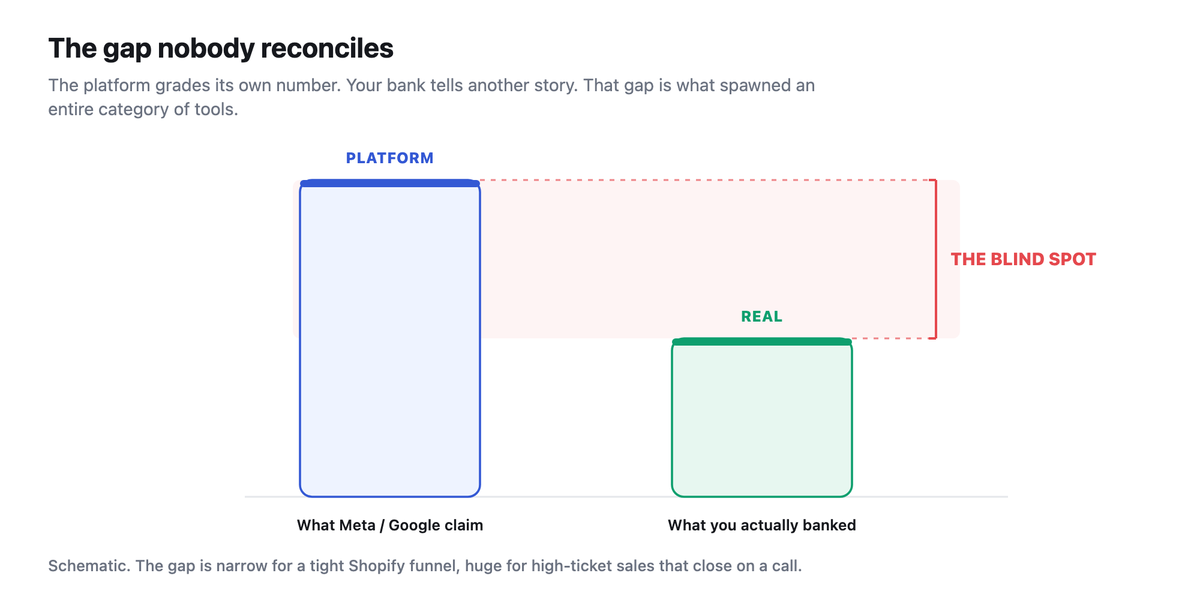
On April 26, 2021, Apple made a window appear on every iPhone. One question, just one: "Allow this app to track you?" Most people tapped "no," and within a few months, fifteen years of ad tracking quietly collapsed. The number landed that fall: Facebook, YouTube, Snap and Twitter together lost close to ten billion dollars in ad revenue in the second half of 2021 alone. Overnight, media buyers everywhere found themselves steering budgets blind, staring at dashboards that suddenly showed numbers the bank no longer agreed with.
An entire industry rushed into that hole. In four years, dozens of attribution tools popped up on the market, each promising the same thing: to give you back the truth about your ads. Some already existed and reinvented themselves; others were born straight out of the post-cookie panic. Today, choosing between them feels like walking through a bazaar where everyone is shouting "the truth is me."
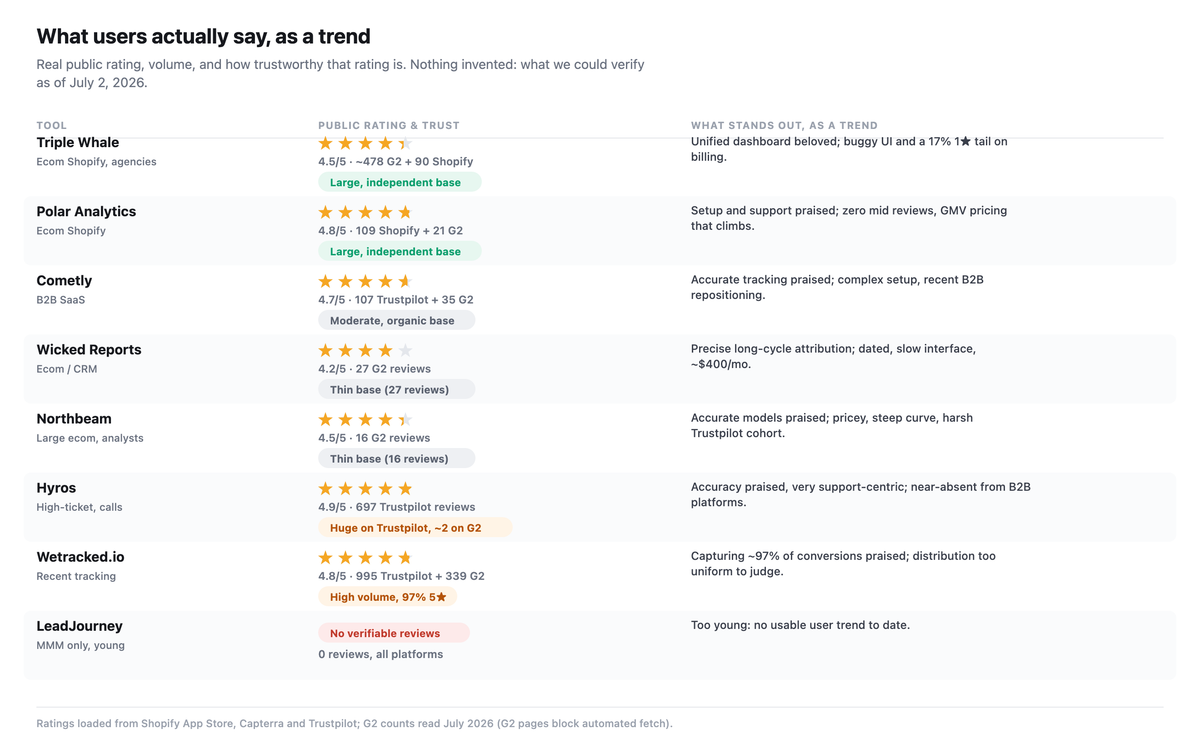
So here is our approach, and it explains everything that follows. We are not a firm that scores software on a spreadsheet. We are marketers, we have spent our own money on advertising, and we have used most of these tools, for real, on real accounts. For this comparison, we crossed that experience with hundreds of public reviews, on G2, Capterra, the Shopify App Store, Trustpilot, and above all with the raw signal from Reddit, where media buyers say what they actually think once the contract is signed. Not a single review brandished as proof. Trends: what the majority praises, what the most clear-eyed customer criticizes, and the frustration that comes up the most.
One disclosure, right away, because it changes how you should read what follows. Metrikia, the tool I build, is on this list. And it was not born from a marketing plan: it was born from our own scars. For months, we put our clients on these tools. Sometimes it was very good. Often it was frustrating, for reasons I spell out below sparing no one, including ourselves. This comparison is the review I wish I had read when it was my turn to choose. Where a competitor is the right call for your situation, I will tell you plainly. And I am not going to conclude for you: by the end, you will have what you need to decide alone.
Two species of tools, and why it decides everything
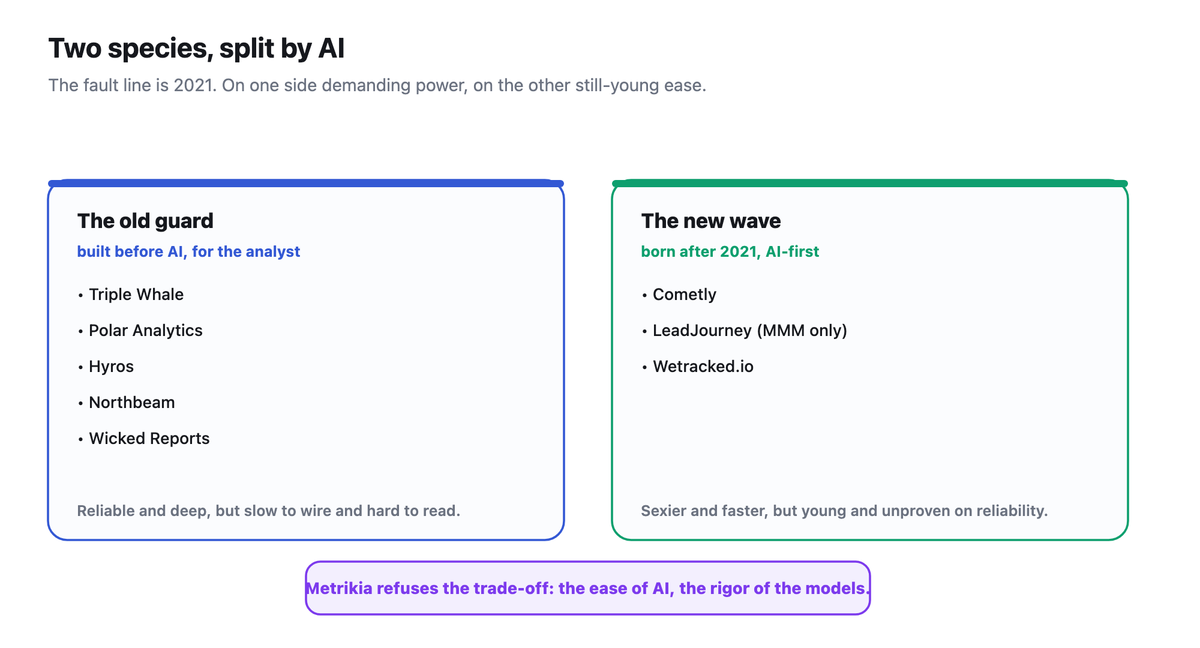
Strip away the branding and you will see that these tools belong to two species, separated by a single fault line: the arrival of AI.
On one side, the old guard. Tools built before AI was a selling point, designed for an analyst who knows what they are doing. They are often powerful, sometimes fearsomely precise, but they share the same dinosaur DNA: a setup measured in weeks, scripts to install, and dashboards so dense that many of their own users quietly admit they do not understand all of it. They give you the truth, provided you have a data analyst to read it.
On the other side, the new wave, born after 2021 with AI in the crib. These tools are sexier, faster to plug in, with interfaces that talk and agents that summarize. The catch is that a product can be beautiful and young at the same time. Some smell of vibe coding, that way of building fast and prettily without the rigor of measurement keeping up. They reassure the eye and sometimes leave a doubt on the number.
The whole question of this comparison sits in that tension. The dinosaurs are reliable but illegible; the AI-first tools are legible but sometimes unreliable. Almost none has managed to be both. Let us look at them one by one, starting with the old guard.
The old guard: powerful, proven, demanding
Triple Whale
It is the most popular ecom consolidator on the market, and the popularity is earned. It aggregates Meta, Google, TikTok, Klaviyo, Amazon and Shopify into a real-time dashboard, with a proprietary first-party pixel, the Triple Pixel, and an in-house AI, Moby. On reviews, the base is large and independent: around 4.5 out of five across nearly five hundred G2 reviews, a lower Shopify rating of 4.2 across ninety reviews, and a one-star tail of seventeen percent that reminds you the tool divides as much as it delights.
What the majority praises is the unified dashboard: seeing every channel in one place, with an attribution clarity that survived iOS. The most clear-eyed criticism, the one that recurs in the three-star reviews, is not about the data but about legibility: one user sums it up bluntly, "the app is okay, but it is full of bugs and the UI is horrible, editing a report or navigating the menus is a mess." The frustration that comes up most is twofold: revenue-indexed pricing seen as expensive and opaque, and above all an experience that degrades after signing, with several clients describing a support team that "seems unsure how to use its own system." The review distribution is in fact bimodal, a majority of enthusiasts and a hard pocket of one-star discontent: the sign of a tool that excels for one precise profile and disappoints everyone else.
Polar Analytics
Same family, different temperament. Polar is a Shopify-native data stack, carried by a high public rating, 4.8 out of five stars across more than a hundred verified Shopify App Store reviews, and a serious funding round in late 2024. What users love is the speed of setup and flexible dashboards with no SQL. The honest criticism is twofold: GMV-indexed pricing that climbs fast, and a smoothness that could be better, with several reviews mentioning a perceptible lag when switching views. It is an excellent ecom reporting tool, as long as your revenue lives in a Shopify checkout.
Hyros
Here is the unapologetic dinosaur, and the word is not an insult. Hyros is not one more pixel, it is long-window server-side tracking, built for the journeys ecom tools cannot follow: high-ticket, coaching, call and webinar sales that close weeks after the click. On that ground it is genuinely strong, and the rare unaffiliated users confirm that "the data was better than what we saw in Meta." But everything else is demanding. Setup routinely takes two to twelve weeks, up to several months in complex cases, a sales demo is mandatory, there is no real free trial, and the dominant criticism is price relative to effort, one client summing it up as "extremely expensive for the value actually delivered." A point of honesty you need to know, and it is subtler than an easy accusation. Hyros carries nearly seven hundred Trustpilot reviews, at 4.9 out of five, and Trustpilot itself notes the company does not solicit those reviews. But two signals call for caution. First, this reputation lives almost entirely on Trustpilot: barely two reviews on G2, zero on Capterra, as if the tool were invisible where B2B buyers compare their software. Second, the content of those reviews is overwhelmingly about support, naming individual reps by first name, far more than about measurement outcomes. Nothing fraudulent, then, but a review base to read for what it is, and precision claims to verify on your own spend before believing them.
Northbeam
Northbeam is the most technically complete of the old guard: machine-learning multi-touch attribution, marketing mix modeling, incrementality and deterministic view-through. When a tool is described as "powerful but you need someone to drive it," it is often this one. Its precision is praised in primary sources, but the depth is also its trap. One agency sums up the learning curve: "the data depth can be overwhelming, especially for a lean team with no analyst." The most violent frustration, verified, is about support: one client recounts that "support was incredible, but they recently pulled it for clients paying up to a thousand a month, onboarding included, I was an absolute fan, today I am looking for an alternative for all my clients." Add several hours of reporting latency and an entry ticket at fifteen hundred dollars a month, and you get a tool built for large brands with a dedicated analyst, oversized for anyone else.
Wicked Reports
The veteran of the lot, with a CRM and info-product heritage. It does order-level multi-touch attribution, with an unlimited lookback window and several models. Its review base is thin but clean: twenty-seven reviews on G2, rated 4.2 out of five, two thirds of them five stars and a small hard pocket at one star. What the majority praises is the first-party precision and the ability to reattach delayed conversions. The number-one frustration, unambiguously, is price, around five hundred to a thousand dollars a month with no free trial, judged prohibitive under ten thousand dollars of monthly spend. The clear-eyed criticism comes next: an interface "from another era," clunky, slow to load. It is a serious engine in a tired body.
The new wave: sexier, younger, worth watching
Cometly
Cometly is the archetype of the new generation: a proprietary pixel, server-side, a layer of AI agents, and a recent, candid repositioning toward B2B SaaS, with the promise of tying every dollar to closed revenue. On paper, it is appealing. In practice, two nuances. First the method: Cometly does multi-touch with several models, but neither marketing mix modeling nor incrementality, which limits analytical depth. Then the reported reliability: the negative reviews, where they exist, all target the same sensitive point, the actual fidelity of the tracking, with advertisers describing a share of their purchases not captured despite a sizable budget. Its review base is moderate but real and organic, one hundred and seven Trustpilot reviews at 4.7 and thirty-five on G2 at 4.8, roughly ten times smaller than the sector's giants. To read while accounting for the product's youth and its recent B2B repositioning.
LeadJourney
LeadJourney has only just popped up, and its bet is radical: it does only marketing mix modeling. That is intellectually defensible, MMM being the method that resists the disappearance of cookies best. But two things must be said plainly. The first is that a single-method tool boxes you in: MMM answers "which channel carries the number" at the aggregate scale, it replaces neither daily tactical tracking nor reconciliation against cash collected. The second is that at this stage, there is almost no verifiable independent review of LeadJourney. That is not a flaw in itself, everyone starts somewhere, but it is a data point: you would be among the first to take the hits, and no user trend yet lets you judge its reliability over time.
Wetracked.io
This is the most counterintuitive case in the comparison. For a tool this recent, you would expect a handful of reviews. It is the opposite: Wetracked.io carries the largest base on this page, nearly a thousand Trustpilot reviews at 4.8 out of five and more than three hundred on G2. Except volume is not reliability. When ninety-seven percent of a young product's reviews are five stars, the distribution is too smooth to be neutral, and that profile usually betrays a very active review-collection motion rather than a spontaneous market verdict. Here too, Trustpilot flags no automated solicitation, so nothing illegal, but a base this uniform does not let you rule on the product's real quality. To treat as a signal to watch, not as proof.
Metrikia: why we built it
I am keeping ours for last, and I will be as honest about it as about the others, because it is precisely having lived through the others that brought it into being.
For months, we put our clients on the tools on this page, and paid out of our own pocket to learn. Three wounds came back, again and again, until they became the reason Metrikia exists. Here they are, unsmoothed.
The setup that steals a quarter. With the most powerful tools, plugging in the measurement is not a checkbox, it is a construction site: scripts to lay down, a mandatory sales demo, weeks of configuration, then the sentence everyone eventually hears, "let the data calibrate for thirty days before you trust it." The problem is not the wait, it is what the wait costs. Through that blind quarter, you keep deciding: you scale, you cut, you arbitrate, on numbers the tool will later tell you to ignore. We watched a client sign in January and get their first trustworthy number in March, after pushing for six weeks a campaign that the data, once it arrived, revealed to be losing money. A long setup does not delay the measurement, it makes you pay for decisions you would never have made with clear sight.
The dashboard nobody dares admit they do not understand. A dashboard you do not understand is not neutral, it is dangerous. We watched very good marketers, people steering seven figures of budget, open a gorgeous interface and quietly admit they did not know what it was saying, having installed it simply because it had been recommended to them. And that is where the trap closes, because faced with an illegible dashboard, you never stay neutral. Either you ignore it, and the data you pay for sleeps in a tab you stop opening. Or, worse, you cling to the one number you think you understand, almost always the platform's ROAS, which is to say the most flattered and the falsest of them all. A tool that produces data you cannot read does not create clarity, it creates the illusion of having decided on facts.
The shaky number, because no single method is enough. Almost no tool brings together the three bricks that, together, make a solid number: performant tracking, multi-touch attribution and marketing mix modeling. This is not a feature detail, it is structural, because each method is blind exactly where the others see. The pixel catches the click but loses the sale that closes offline, on a call, weeks later. Multi-touch attribution spreads credit across the journey, but inherits the holes of the pixel that feeds it. Marketing mix modeling reads each channel's contribution at the budget scale, but will never tell you which creative to cut tomorrow morning. A tool that masters only one hands you a confident number balanced on a single leg. And the day two of these tools give you results that diverge by forty percent, and it happens, you have no way to know which one is lying.
Metrikia is our answer to those three wounds, taken one by one, and it refuses the old trade-off between power and legibility.
Against the setup that steals a quarter, an AI-assisted onboarding: you connect your sources, the AI does most of the wiring, and a developer and a product owner of ours finish the hookup with you, not a ticket lost in a queue. Against the dashboard nobody dares question, an analysis layer, Diana, that reads your reconciled data and answers in natural language: you ask why the number moved, she answers, and deep data becomes a conversation again. Against the shaky number, the depth few bring under one roof: nine multi-touch attribution models, marketing mix modeling, server-side tracking, and on top a reconciliation of spend against the revenue actually collected in your store, your CRM and your payments, deduplicated across channels so that one sale stays one sale.
It is the tool we wanted to find when it was our turn to choose, and did not. So we built it.
The comparison, at a glance
Enough prose, here is the grid. The eight tools set side by side on what actually matters, with no ranking, just facts to cross against your situation.
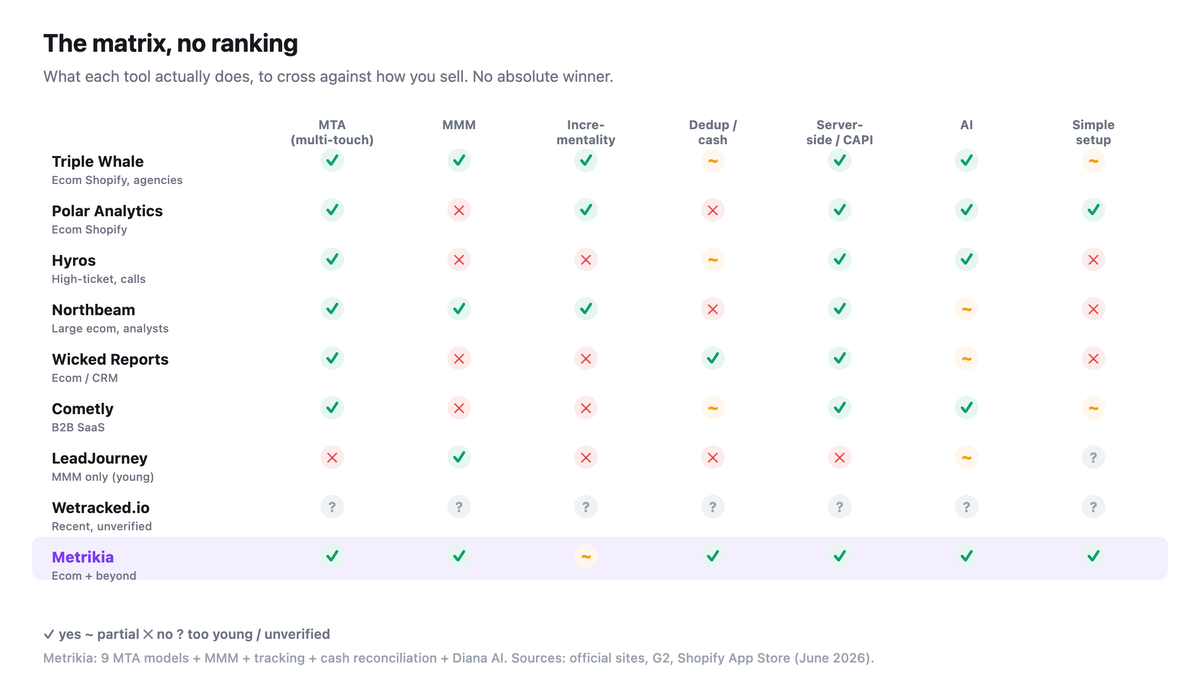
Read this matrix for what it is: a map, not a verdict. A tool that checks every box does not exist, and the tool that checks the boxes that matter to you depends entirely on how you sell. A pure Shopify brand and a high-ticket coaching business will not read the same row as a strength.
So, it is your call
I am not going to conclude for you, and that is on purpose. You now know the two species, what each tool actually does, what its users think once the contract is signed, and where each is strong or weak. That is more than most comparisons give you, and it is enough to decide alone.
One thing only, before you go. Whatever tool you choose, demand three things: that it plugs in without costing you a quarter, that you understand its numbers without an analyst beside you, and that it anchors its verdict to the money that actually reached your account. If those three demands speak to you, you already know where to look for us.
References
ATTN Agency. (2025). Northbeam review: Is it worth it for Shopify brands? https://www.attnagency.com/blog/northbeam-shopify-review
Hyros. (n.d.). Ad tracking and attribution. https://hyros.com
Polar Analytics. (n.d.). All-in-one data stack for ecommerce [Shopify App Store listing]. https://apps.shopify.com/polar-analytics
ProfitableAds. (n.d.). Hyros review. https://profitableads.com/hyros-review
Triple Whale. (n.d.). The AI operating system for modern ecommerce. https://www.triplewhale.com
Wicked Reports. (n.d.). The attribution system that finds new customers. https://www.wickedreports.com
About the author: Baptiste Noel, co-founder of Metrikia. MSc in Clinical Neuroscience and MSc in High Performance.